
Insights in Seniors Housing & Care
In a NIC Notes blog published June 23, 2022, NIC Analytics examined jobs in the skilled nursing and senior housing sectors by looking at employment patterns since March 2020. The analysis included insights on workforce contraction and recovery in the sectors, as well as wage increases, compared with other adjacent healthcare industry groups. The blog provided context on jobs and wages for all employees within select healthcare industry groups.
In this follow-up blog, NIC Analytics compiled 2021 Occupational Employment and Wage Statistics (OEWS) data from the Bureau of Labor Statistics (BLS) to provide a detailed overview of jobs and wages for nursing staff and aides, including registered nurses, licensed practical and licensed vocational nurses, nursing assistants, and home health and personal care aides across all U.S. states. The primary purpose of this analysis and complimentary state report is to pinpoint where skilled nursing (SNF) and senior housing (CCRC and assisted living) jobs stood in 2021 compared with the competitive landscape (i.e., other industries & healthcare settings).
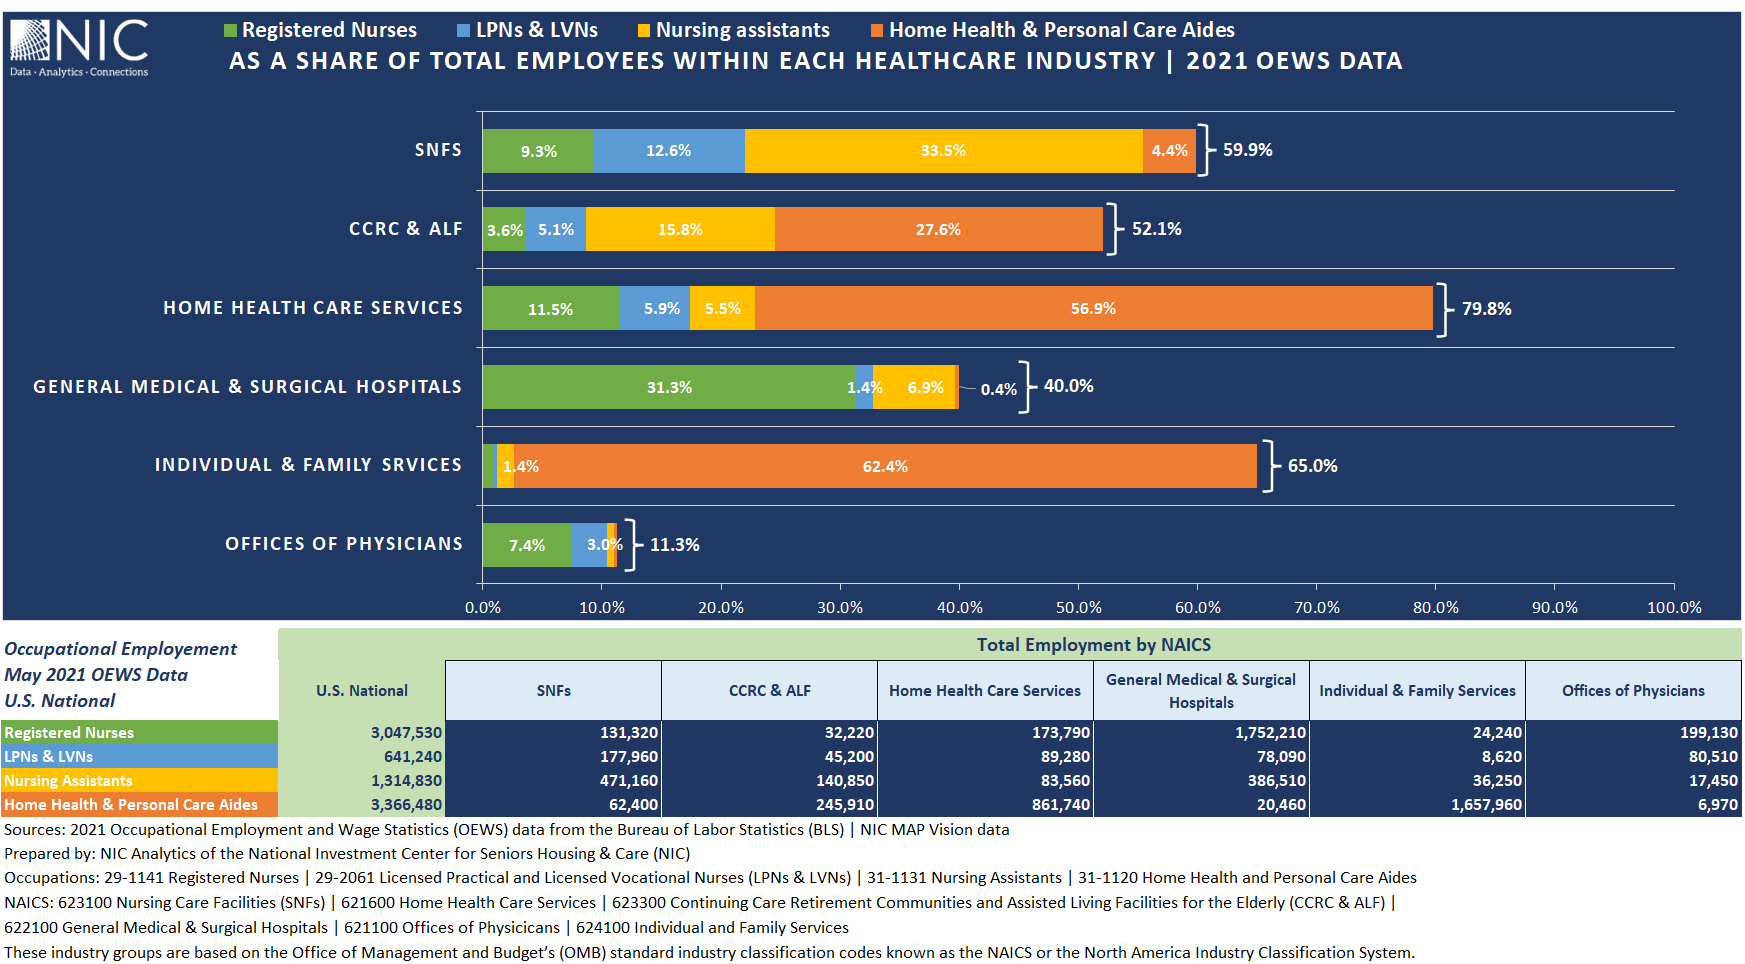
The competitive landscape includes six select healthcare industries that employ 81% of the nation’s four occupations listed above (nursing staff and aides). These are: (1) skilled nursing facilities, (2) home health care facilities, (3) continuing care retirement communities and assisted living facilities for the elderly (CCRC & AL), (4) general medical and surgical hospitals, (5) individual and family services, and (6) offices of physicians. These industry groups are based on the Office of Management and Budget’s (OMB) standard industry classification codes known as the NAICS or the North America Industry Classification System.
The complimentary state occupational employment and wages report at the end of this blog provides state level data.
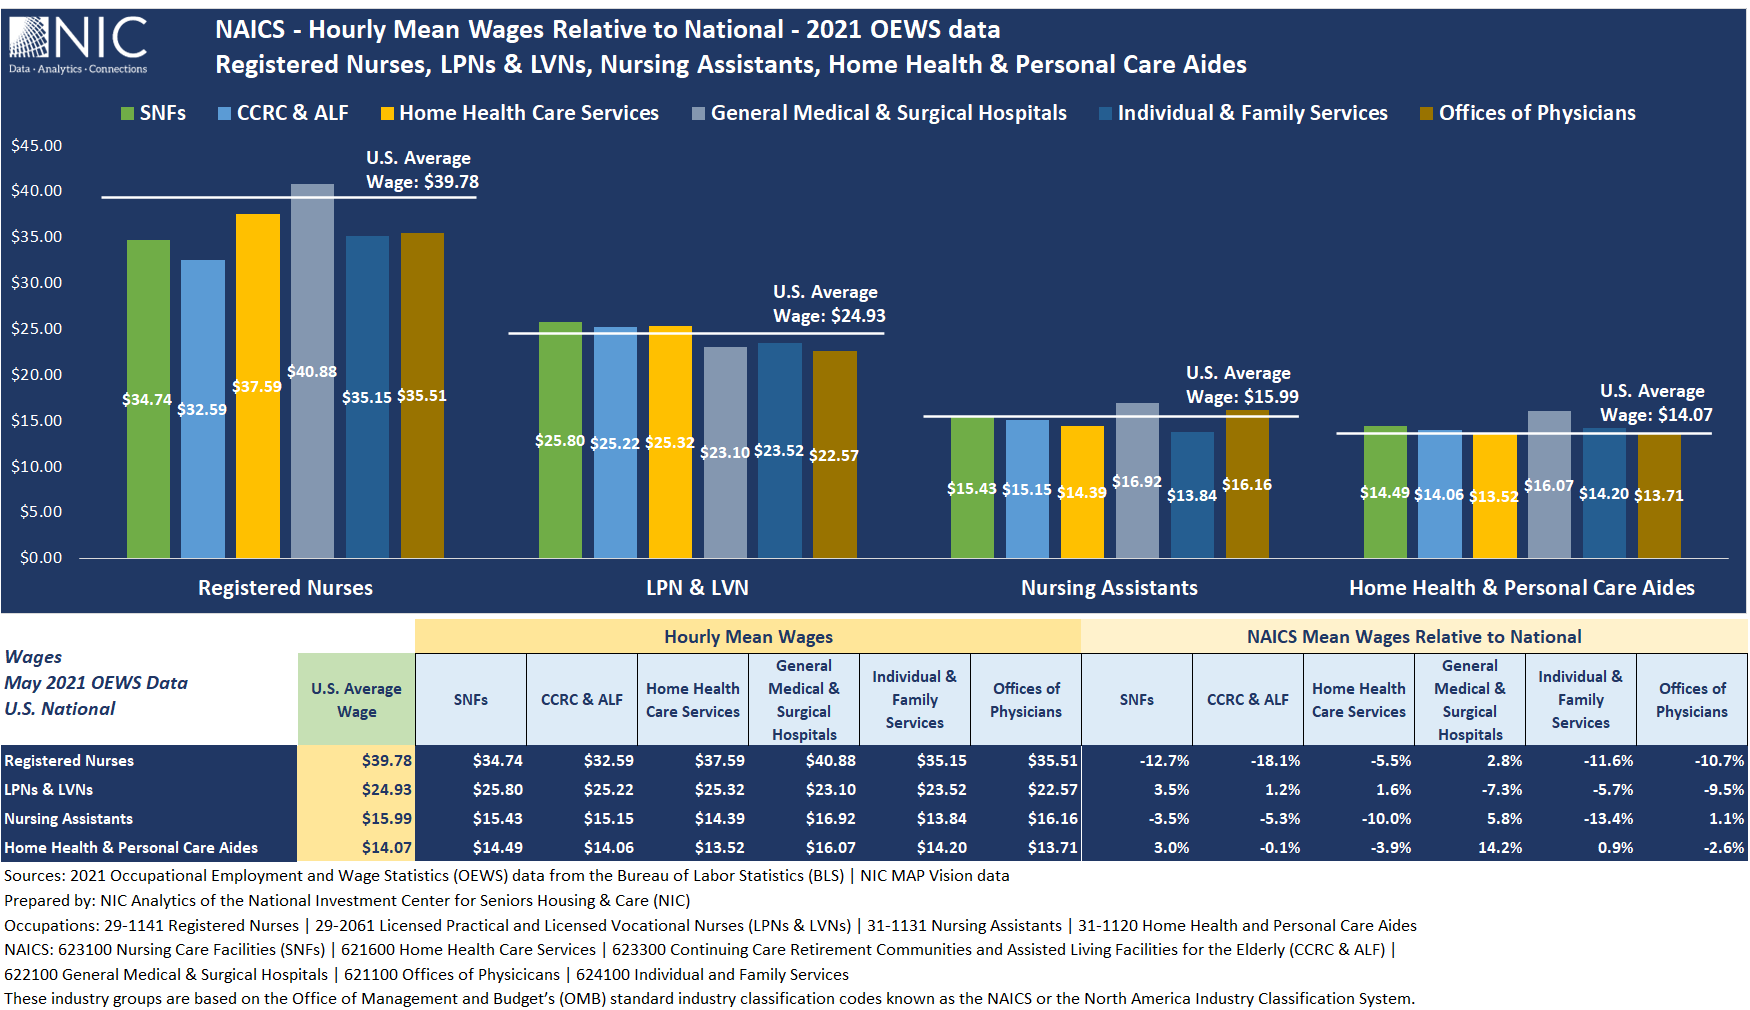
Other than registered nurses, skilled nursing and senior housing wage rates were somewhat competitive compared with the U.S. average wages and other healthcare industries (based on the vintage of the BLS data which is date stamped May 2021). This suggests that workforce attraction and retention are more about a mix of other factors than just workers’ pay.
The complimentary state occupational employment and wages report at the end of this blog provides state level data.
Labor availability continues to be a major challenge for the skilled nursing and senior housing sectors. Labor shortages have been exacerbated by a shrinking labor force. Many workers have dropped out of the workforce or changed industries. Further, the labor force participation rate remains well below pre-pandemic levels at 62.2% as of June 2022, 1.2 percentage points below the pre-pandemic level of 63.4%. Due to the COVID pandemic and its related economic cycle, there are fewer jobs today in skilled nursing and senior housing than in March 2020. See the NIC Notes blog published on June 23, 2022, for more details.
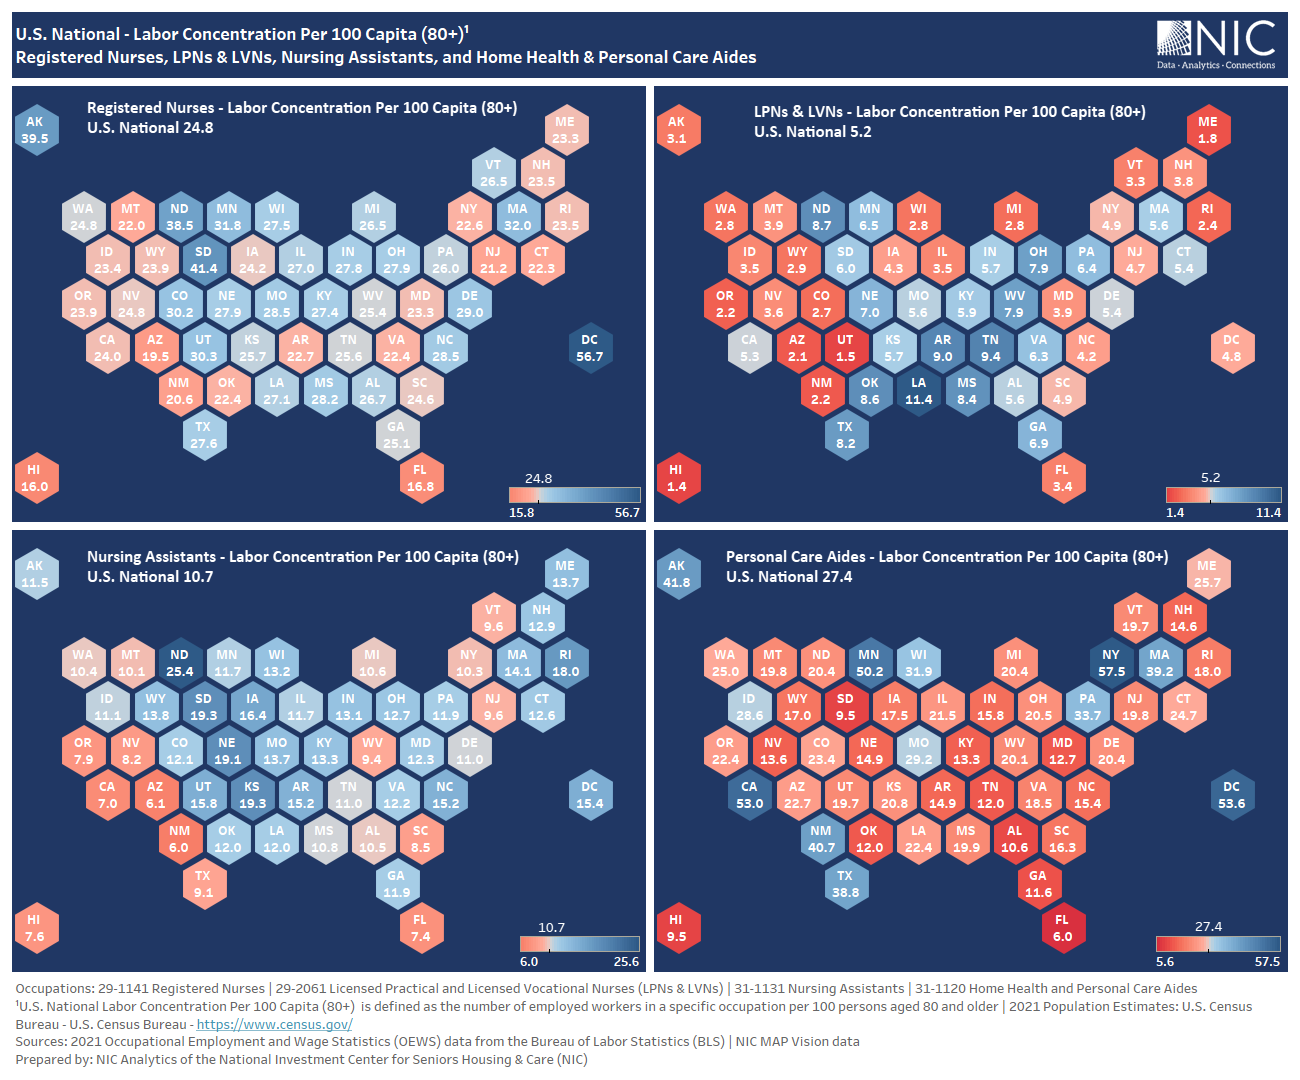
For this blog, we have created a labor concentration ratio as a measure of job intensity or concentration, where the ratio is defined as the number of employed workers in a specific occupation per 100 persons aged 80 and older, i.e., how many workers are employed per older adult.
For the LPNs and LVNs occupation category, this equates to 5.2 LPNs and LVNs for every 100 eighty-year-olds, while for nursing assistants, this ratio is 10.7. By comparison, there are more workers for each older adult for registered nurses (24.8) and aides (27.4). Notably, as Exhibit 1 shows, LPNS and LVNs and nursing assistants comprised the largest share of total employees in skilled nursing (46.1%), while registered nurses and aides accounted for a smaller share at 13.7% of all employees.
A higher or lower labor concentration ratio is a factor of both the number of employed workers in a specific occupation and the number of persons aged 80 and older. For this metric, a labor concentration ratio is considered higher or lower than the national average if it’s above or below the national average by at least +/-10%. See the complimentary state occupational employment and wages report at the end of this blog for more details.
Registered Nurses. There are some states with higher ratios and some with lower labor concentration ratios. Overall, 18 states had labor concentrations higher than the national average of 24.8 by at least +/-10%. Some of these states include Colorado (30.2), Indiana (27.8), Massachusetts (32.0), Ohio (27.9), and Texas (27.6). The lowest labor concentration ratios (below at least +/- 10% of national ratio) occurred in New Jersey (21.2), New Mexico (20.6), and Florida (16.8)
LPNs and LVNs. Overall, 16 states had labor concentrations higher than the national average of 5.2 by at least +/-10%. The largest labor concentration ratios were seen in Louisiana (11.4), Oklahoma (8.6), and Texas (8.2). Some of the lowest labor concentration ratios (below at least +/- 10% of national ratio) were seen in New Mexico (2.2), Oregon (2.2), Utah (1.5)
Nursing Assistants. 27 states had labor concentrations higher than the national average of 10.7. Kansas (19.3), Nebraska (19.1), and Wisconsin (13.2) were among the states with the highest labor concentration ratios, while California (7.0), Nevada (8.2), and Florida (7.4) were among the states with the lowest labor concentration ratios. Interestingly, California employed the largest number of nursing assistants in 2021 (94,450) across all U.S. States. At the same time, the number of persons aged 80 and older in California was relatively high (1,352,968), resulting in a lower labor concentration ratio for nursing assistants than the national average.
Home Health and Personal Care Aides. 10 states had labor concentrations higher than the national average of 27.4. The highest labor concentration ratios for aides occurred in New York, (57.5), Washington, DC (53.6), and California (53.0). Illinois (21.5), Alabama (10.6), and New Jersey (19.8) were among the states with the lowest labor concentration ratios.
This article has highlighted the state of the labor market for nursing staff and aides in skilled nursing, senior housing, as well as adjacent healthcare industries. In addition, NIC Analytics compiled 2021 data from the Bureau of Labor Statistics (BLS) to provide a detailed overview of occupational employment and wages by state, available to download below or on our website. For questions about the complimentary state occupational employment and wages report, please contact us at analytics@nic.org.
The complimentary state occupational employment and wages report provides another alternative measure of job intensity or concentration for skilled nursing - full-time equivalent ratio (FTE Ratio) - where the ratio is defined as the total number of persons employed in skilled nursing by a specific occupation per 100 certified beds. Both the FTE and labor concentration ratios are an important distinction in the context of policy discussions currently underway regarding staffing mandates. For example, if staffing mandates were to change, skilled nursing facilities in states where these ratios are low may be required to implement higher minimum nursing staff-to-resident ratios, and meeting those requirements could be challenging.
Complimentary State Occupational Employment and Wages Report (PDF)
Complimentary State Occupational Employment and Wages Report (Excel)
Omar Zahraoui, Principal at the National Investment Center for Seniors Housing & Care (NIC), is a seniors housing research professional with expertise in providing quantitative analysis and insights on seniors housing & care market data; building new products and reporting capabilities, including dashboards and proformas for clients and internal stakeholders; and implementing new processes and data solutions. Prior to his current role, Zahraoui worked as a data analyst, at Calpine Corporation, supporting the development of new-business strategy initiatives, analyzing sales and financial data, and developing statistical modeling of consumers’ behaviors to drive business performance. Zahraoui holds a Bachelor’s degree in Business Administration with concentrations in Finance and Management, a Master in Corporate Finance from IAE Lyon School of Management at Jean Moulin Lyon III University in France, and a Master of Science in Management Information Systems and Data Analytics from Pace University.
Connect with Omar Zahraoui