Insights in Seniors Housing & Care
As the leading data provider for the seniors housing and care sector, the NIC MAP® Data Service (NIC MAP) tracks occupancy, asking rents, demand, inventory and construction data for independent living, assisted living, memory care, skilled nursing and continuing care retirement communities (CCRCs), also referred to as life plan communities, for more than 15,000 properties across 140 metropolitan areas. NIC MAP currently tracks 1,208 not-for-profit and for-profit entrance fee and rental CCRCs in these 140 combined markets (1,137 in the 99 combined Primary and Secondary Markets).
CCRCs offer multiple care segments (at a minimum independent living and nursing care) typically by a single provider on one campus. This analysis breaks the care segment types apart from the CCRC community type that NIC MAP includes under the main category of seniors housing. Care segment type refers to each part or section of a property that provides a specific level of service, i.e., independent living, assisted living, memory care or nursing care. The following analysis examines current conditions and year-over-year changes in inventory, occupancy, and same store asking rent growth—by care segments within CCRCs (CCRC segments) compared to non-CCRC segments in freestanding or combined communities to focus a lens on the relative performance of care segments within CCRCs.
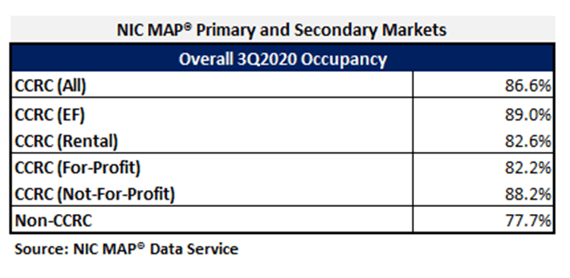
In the third quarter of 2020 (two quarters into the COVID-19 pandemic) CCRC occupancy, which is inclusive of stabilized and non-stabilized units, entrance fee and rental payment types, in both not-for-profit and for-profit communities across the Primary and Secondary Markets fell 260 basis points from 2Q 2020, when it was at its lowest point since NIC MAP began reporting the data (89.2%). Prior to the 2Q 2020 trough, CCRC occupancy oscillated around 91% for 22 consecutive quarters. Non-CCRC occupancy averaged 77.7% in 3Q 2020—a very wide 8.9 percentage points lower than CCRC occupancy. Entrance fee CCRC occupancy (89.0%) was 6.4 percentage points higher than rental CCRCs (82.6%), and not-for-profit CCRC occupancy (88.2%) was 6.0 percentage points higher than for-profit CCRCs (82.2%).
The wide discrepancies in occupancy rates during the COVID-19 pandemic are varied. They can be explained, in part, because new CCRC residents are generally healthier than residents in other types of seniors housing resulting in lower resident turnover in CCRCs. CCRCs also typically have larger campuses and differentiated residential environments separated by care segment—which may allow operators to mitigate spread of the virus by protecting more vulnerable populations in autonomous settings. Additionally, the contract stipulations of entrance fee CCRCs, which tend to be varied and unique, may attract retirees who may have been less inclined to move out during the pandemic. A special report from NIC’s Executive Survey Insights, regarding CCRC performance for two time periods during pandemic (March 24-April 12 and April 27-May 24) from owners and C-suite executives of operators of seniors housing and care properties across the country, can be found here for additional insights regarding move-in and move-out rates, and changes in occupancy.
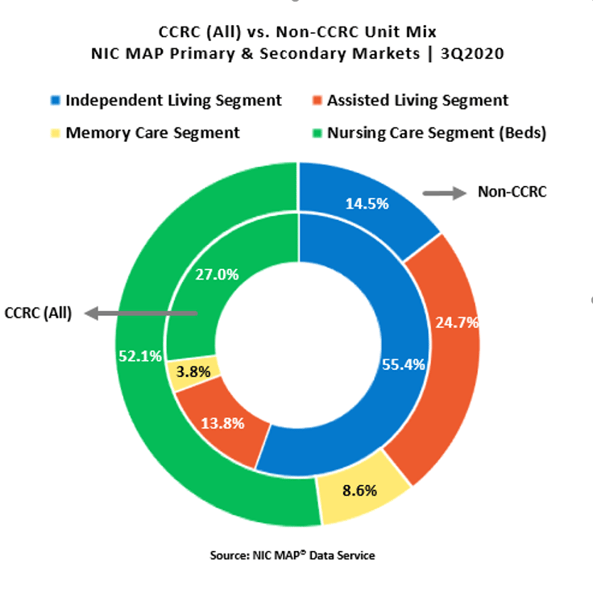
Another potential reason for the difference in occupancy rates may be a result of the relative influence of the majority inventory mix in CCRCs compared to non-CCRC communities (freestanding and combined). As shown in the chart, in aggregate, CCRCs are comprised of a majority of independent living care segment units (55.4%), followed by nursing care units (27.0%), assisted living units (13.8%), and memory care units (3.8%). Compared to CCRCs, non-CCRCs have lower proportions of independent living care segment units (14.5%), and higher proportions of nursing care units (52.1%), assisted living units (24.7%) and memory care units (8.6%) than CCRCs. Thus, the overall CCRC occupancy rate, compared to the overall non-CCRC occupancy rate, may be influenced positively by majority unit mix.
The CCRC independent living care segment (which represents 55.4% of CCRC units) garnered the highest occupancy in the third quarter of 2020 (90.4%), as well as the least drop in occupancy year-over-year, falling 2.2 percentage points. The current nursing care segment occupancy rate in non-CCRCs, which represents 52.1% of non-CCRC units, was much lower at 75.5%, and fell 10.4 percentage points year-over-year.
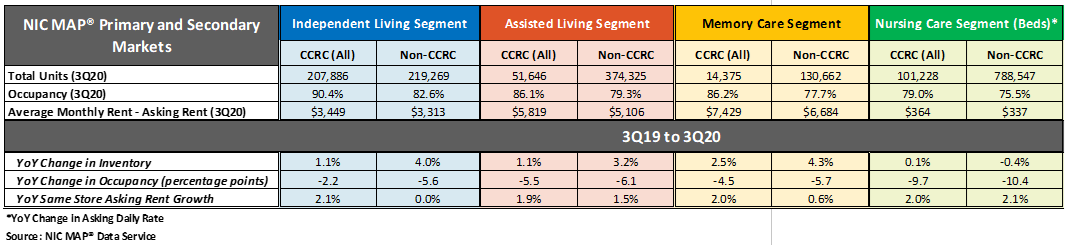
The table below compares each of the care segments—independent living, assisted living, memory care and nursing care—in the Primary and Secondary Markets. The table shows the 3Q 2020 total open units, occupancy and average monthly asking rent—and year-over-year changes for CCRCs and non-CCRCs.
Click to Expand
Higher Occupancy at CCRCs
The CCRC independent living care segment had the highest 3Q 2020 occupancy (90.4%), followed by CCRC memory care (86.2%), assisted living (86.1%), and nursing care (79.0%). Among non-CCRCs, the independent living care segment had the highest 3Q 2020 occupancy (82.6%), followed non-CCRC assisted living (79.3%), memory care (77.7%) and nursing care (75.5%).
The difference in 3Q 2020 occupancy between CCRCs and non-CCRCs was the highest for the memory care segment (8.5 percentage points), followed by the independent living care segment (7.8 percentage points), the assisted living care segment (6.7 percentage points) and the nursing care segment (3.5 percentage points).
Occupancy declined, year-over-year, for each of the care segments. However, CCRCs had lower declines in occupancy than non-CCRCs Among CCRCs, independent living care segment occupancy declined the least (-2.2 percentage points), followed by memory care (-4.5 percentage points), assisted living (-5.5 percentage points), and the nursing care segment (-9.7 percentage points). Among non-CCRCs, independent living and memory care segment occupancy declined the least (-5.6 and -5.7 percentage points, respectively), followed by assisted living (-6.1 percentage points), and the nursing care segment (-10.4 percentage points).
Higher Annual, Same Store Asking Rent Growth at CCRCs
CCRC same store year-over-year asking rent growth in the third quarter of 2020 was 2.5%, down from the time series high of 4.7% reached in the first quarter of 2019, but higher than the time series low of 2.1% at the end of 2010, beginning of 2012, and the end of 2013. Year-over-year asking rent growth did not vary significantly across the CCRC care segments unlike the non-CCRC care segments; the variation was only 20 basis points for CCRCs but 210 basis points for non-CCRCs. Among CCRCs, the highest year-over-year asking rent growth was 2.1% in the independent living segment; among non-CCRCs it was highest in the nursing care segment (2.1%). The lowest year-over-year asking rent growth was noted for CCRCs in the assisted living care segment (1.9%); in non-CCRCs it was noted for the independent living care segment (0.0%), followed by the memory care segment (0.6%).
Significantly Weaker Inventory Growth at CCRCs
Non-CCRCs had significantly higher rates of inventory growth (year-over-year change in inventory) by segment, than CCRCs. The highest rate of inventory growth was reported for non-CCRCs in the memory care and independent living care segments (4.3% and 4.0%); the lowest was reported for both CCRCs and non-CCRCs in the nursing care segment (0.1% and -0.4%, respectively).
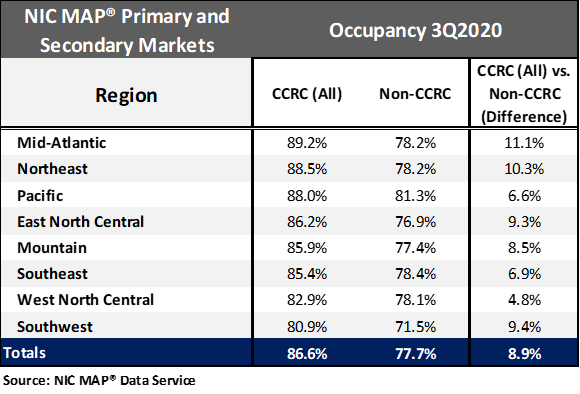
Regional Occupancy Differences are Highest in the Mid-Atlantic, Northeast, and Pacific The current occupancy rates for CCRCs and non-CCRCs by region are shown in the table below. Overall, CCRC occupancy was stronger than non-CCRC occupancy by 8.9 percentage points. Seniors housing and care communities in the Mid-Atlantic, Northeast, and Pacific regions, which were more significantly impacted earlier in the pandemic than other regions, currently have the strongest CCRC occupancy rates ranging from 89.2% to 88.0%. The weakest CCRC (and non-CCRC) occupancy is in the Southwest at 80.9% and 71.5%, respectively—a 9.4 percentage point difference.
Look for future blog posts from NIC to delve deep into the performance of CCRCs. For further information on NIC, its reports, data, and analytics available to providers, please visit the NIC website at www.nic.org.
To learn more about NIC MAP® Data Service, and the latest metro-level data available to support your organization, schedule a meeting with a product expert today.
Lana Peck, former senior principal at the National Investment Center for Seniors Housing & Care (NIC), is a seniors housing market intelligence research professional with expertise in voice of customer analytics, product pricing and development, market segmentation, and market feasibility studies including demand analyses of greenfield developments, expansions, repositionings, and acquisition projects across the nation. Prior to joining NIC, Lana worked as director of research responsible for designing and executing seniors housing research for both for-profit and nonprofit communities, systems and national senior living trade organizations. Lana’s prior experience also includes more than a decade as senior market research analyst with one of the largest senior living owner-operators in the country. She holds a Master of Science, Business Management, a Master of Family and Consumer Sciences, Gerontology, and a professional certificate in Real Estate Finance and Development from Massachusetts Institute of Technology (MIT).
Connect with Lana Peck