Did move-ins continue to outpace move-outs in the third quarter 2021? What were the rate discounting trends by segment? How did asking rates grow on a year-over-year basis? The 3Q2021 NIC MAP® Actual Rates Report, available to NIC MAP subscribers, offers third quarter data trends through September 2021 for actual rates and leasing velocity. We’ve summarized some of the key takeaways from the report below.
The following key takeaways are pulled from the NIC MAP Segment Type report. Care segments refer to the levels of care and services provided to a resident living in an assisted living, memory care or independent living unit.
Key Takeaways
- For the second quarter in a row, move-ins outpaced move-outs for all three care segments (independent living, assisted living, and memory care) in 3Q21. This marks seven consecutive months of move-ins outpacing move-outs, from March 2021 through September 2021.
- The memory care segment had the highest pace of move-ins of the three care segments in the third quarter at 3.9% of inventory in July and August of 2021. This was down from the recorded high of 4.7% of inventory in March of 2021, however.
- The year-over-year growth rate for assisted living asking rates reached the highest recorded level in the time series at 5.2% in September 2021. For independent living, the comparable rate was 2.5% in September 2021 and for memory care the rate was 1.6%. For memory care that was the highest pace since June 2019 when it was 1.7%.
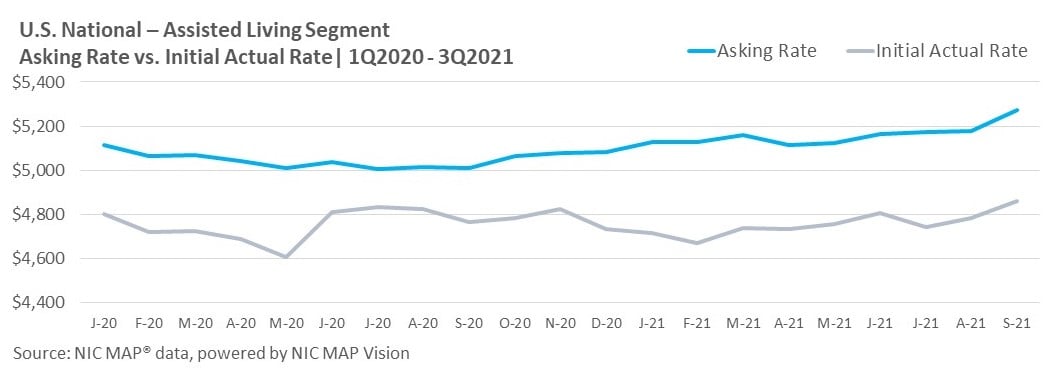
- Average initial rates for residents moving into independent living, assisted living, and memory care segments were below average asking rates, with monthly spreads largest for memory care.
-
-
- In September 2021, memory care segment initial rates had a discount of 9.3% ($609) from asking rates, which equates to 1.1 months on an annualized basis. This is up from the prior year when the September 2020 discount was 7.5% ($487).
-
-
- Assisted living segments had an initial rate discount of 8.3% ($431) relative to asking rates in July 2021 and ended the quarter with a discount of 7.8% ($412) in September 2021. September’s assisted living initial rate discount is up from one year prior when it was 4.9% ($246).
Our Software Partners Support this Initiative
At the 2021 NIC Fall Conference in Houston, Texas, Glennis Solutions and Eldermark were proudly announced as being officially certified Actual Rates Software Partners. Glennis Solutions and Eldermark now offer their senior housing operator customers the ability to share their data more efficiently in the official NIC Actual Rates format. To receive certification, a software provider works with the NIC MAP Vision team to develop reports that meet the NIC Actual Rates standard format. They are then required to provide six months’ worth of actual rates data for two or more operators using those reports.
NIC and NIC MAP Vision appreciate the time, effort, and commitment from our software partners. We thank Glennis Solutions and Eldermark for their partnerships and recognize their accomplishments in receiving official certification status.
The Actual Rates Data Initiative is driven by the need to continually increase transparency in the seniors housing sector and achieve greater parity to data that is available in other real estate asset types. Now, more than ever, having access to accurate data on the actual monthly rates that a senior housing resident pays as compared to property level asking rates helps the sector achieve this goal.
About the Report
The NIC MAP® Seniors Housing Actual Rates Report provides aggregate national data from approximately 300,000 units within more than 2,600 properties across the U.S. operated by 25 to 30 seniors housing providers. The operators included in the current sample tend to be larger, professionally managed, and investment-grade operators as we currently require participating operators to manage five or more properties. Note that this monthly time series is comprised of end-of-month data for each respective month.
While these trends are certainly interesting aggregated across the states, actual rates data is even more useful at the metro level. NIC MAP Vision currently reports on the Atlanta, Philadelphia, and Phoenix metropolitan markets, and is continuing to work towards reporting more markets.
Interested in Participating?
The Actual Rates Data Initiative is an effort to expand seniors housing data and we are looking for operators who have five or more properties to participate. We have expertise in extracting data from industry leading software systems, such as Yardi, PointClickCare, Alis, MatrixCare, Glennis Solutions, and Eldermark and can facilitate the process for you.
Operators contributing data to the NIC MAP Actual Rates report receive a complimentary report which allows them to compare their own data against national, and metropolitan market benchmarks.
In addition to receiving a complimentary report, your organization benefits through:
-
- More informed benchmarking, strategic planning, and day-to-day business operations,
Increased transparency, aligning with other commercial real estate assets in terms of data availability,
-
- Saved time, Actual Rates data is collected electronically directly from operators’ corporate offices, removing the need for telephone calls to individual properties, and
-
- Enhanced investment and efficiency across the sector.
Learn more.

