
Insights in Seniors Housing & Care
As the leading data provider for the seniors housing and care sector, the NIC MAP® Data Service (NIC MAP) tracks occupancy, asking rents, demand, inventory, and construction data for independent living, assisted living, memory care, nursing care, and continuing care retirement communities (CCRCs), also referred to as life plan communities. This data is collected for more than 15,000 properties across 140 metropolitan areas. NIC MAP currently tracks 1,208 not-for-profit and for-profit entrance fee and rental CCRCs in these 140 combined markets (1,137 in the 99 combined Primary and Secondary Markets).
The following analysis examines current conditions and year-over-year changes in inventory, occupancy, and same store asking rent growth—by care segments within CCRCs (CCRC segments) compared to non-CCRC segments in freestanding or combined communities to focus a lens on the relative performance of care segments within CCRCs.
Current CCRC Occupancy by Payment Type and Profit Status
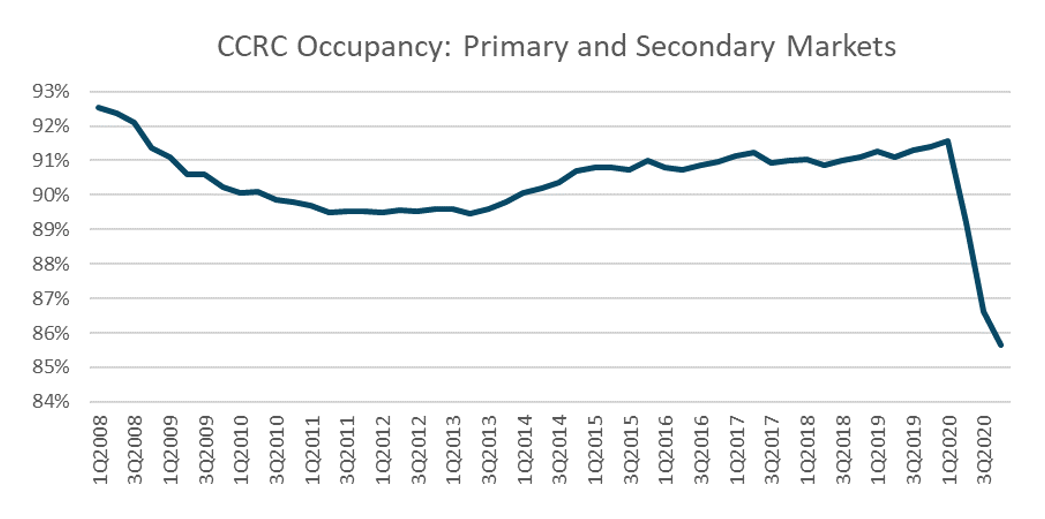
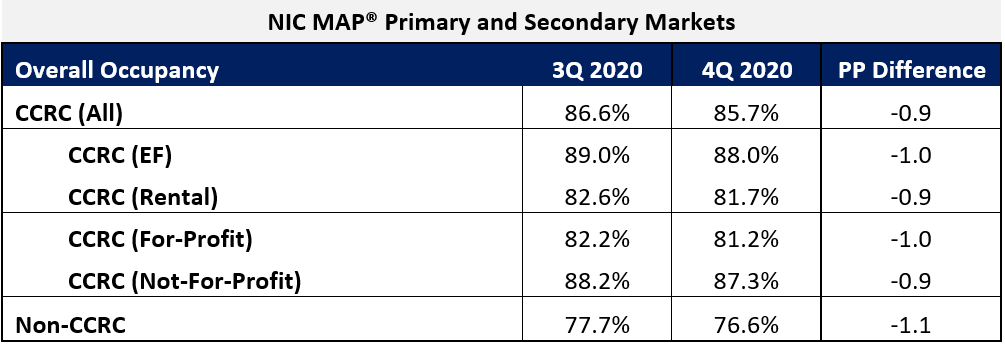
In the fourth quarter of 2020, CCRC occupancy fell 90 basis points from the third quarter to 85.7%, its lowest level since NIC MAP began reporting the data in 2006. The cumulative drop in occupancy was 350 basis points since the pandemic began to have an impact on occupancy rates. Prior to 2Q 2020, CCRC occupancy oscillated around 91% for 22 consecutive quarters.
Non-CCRC occupancy averaged 76.6% in 4Q 2020—a very wide 9.1 percentage points lower than CCRC occupancy (85.7%). Entrance fee CCRC occupancy was 6.3 percentage points higher (88.0%) than rental CCRCs (81.7%), and not-for-profit CCRC occupancy was 6.1 percentage points higher (87.3%) than for-profit CCRCs (81.2%).
CCRCs vs. Non-CCRCs: Care Segment Detail
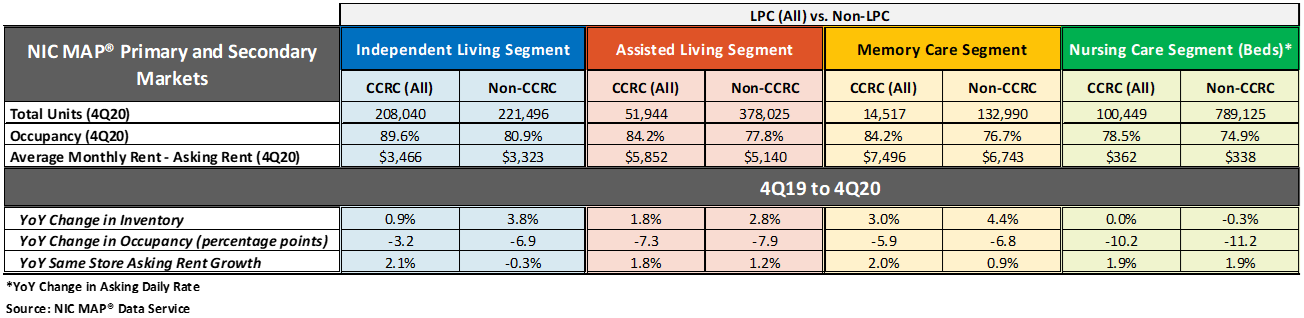
The table below compares each of the care segments—independent living, assisted living, memory care, and nursing care—in the Primary and Secondary Markets. The table shows the 4Q 2020 total open units, occupancy and average monthly asking rent—and year-over-year changes for CCRCs and non-CCRCs.
The CCRC independent living care segment (which represents 55.5% of CCRC units) garnered the highest occupancy in the fourth quarter of 2020 (89.6%), as well as the least year-over-year drop in occupancy falling 3.2 percentage points. The current nursing care segment occupancy rate in non-CCRCs, which represents 51.9% of non-CCRC units, was much lower at 74.9%, and fell 11.2 percentage points year-over-year.
Higher occupancy at CCRCs
The CCRC independent living care segment had the highest 4Q 2020 occupancy (89.6%), followed by CCRC assisted living and memory care (84.2%, respectively), and CCRC nursing care (78.5%). Among non-CCRCs, the independent living care segment had the highest 4Q 2020 occupancy (80.9%), followed non-CCRC assisted living (77.8%), memory care (76.7%) and nursing care (74.9%).
The difference in 4Q 2020 occupancy between CCRCs and non-CCRCs was the highest for the independent living segment (8.7 percentage points), followed by the memory care segment (7.5 percentage points), the assisted living care segment (6.5 percentage points), and the nursing care segment (3.6 percentage points).
Occupancy declined from year-earlier levels for each of the care segments. However, CCRCs had lesser declines in occupancy than non-CCRCs. Among CCRCs, independent living care segment occupancy declined the least (-3.2 percentage points), followed by memory care (-5.9 percentage points), assisted living (-7.3 percentage points), and the nursing care segment (-10.2 percentage points). Among non-CCRCs, memory care and independent living segment occupancy declined the least (-6.8 and -6.9 percentage points, respectively), followed by assisted living (-7.9 percentage points), and the nursing care segment (-11.2 percentage points).
Higher annual, same store asking rent growth at CCRCs
Overall, CCRC same store year-over-year asking rent growth in the fourth quarter of 2020 was 2.4%, down from the time series high of 4.7% reached in the first quarter of 2019, but slightly higher than the time series low of 2.1% at the end of 2010, the end of 2013 and beginning of 2014. Year-over-year asking rent growth did not vary significantly across the CCRC care segments unlike the non-CCRC care segments; the variation was only 30 basis points for CCRCs but 220 basis points for non-CCRCs. Among CCRCs, the highest year-over-year asking rent growth was 2.1% in the independent living segment; among non-CCRCs it was highest in the nursing care segment (1.9%). The lowest year-over-year asking rent growth was noted for CCRCs in the assisted living care segment (1.8%); in non-CCRCs it was noted for the independent living care segment (-0.3%).
Significantly weaker inventory growth at CCRCs
Non-CCRCs had higher rates of inventory growth (year-over-year change in inventory) by segment than CCRCs, with the exception of the nursing care segment. The highest rates of inventory growth were reported for non-CCRCs in the memory care and independent living care segments (4.4% and 3.8%); the lowest were reported for both CCRCs and non-CCRCs in the nursing care segment (0.0% and -0.3%, respectively). Negative inventory growth can occur when units/beds that are temporarily or permanently taken offline, or converted to another care segment, outweigh added inventory.
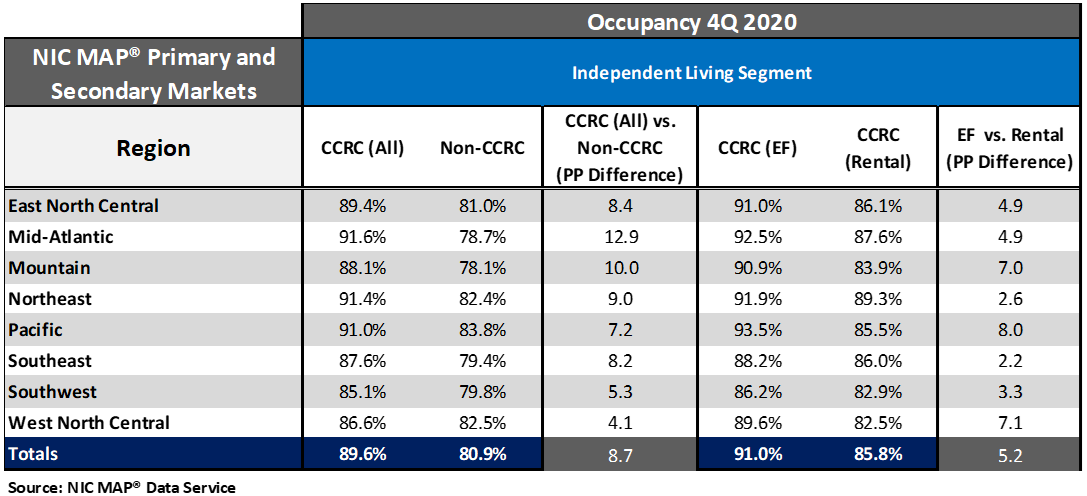
Occupancy rates vary by region and payment type
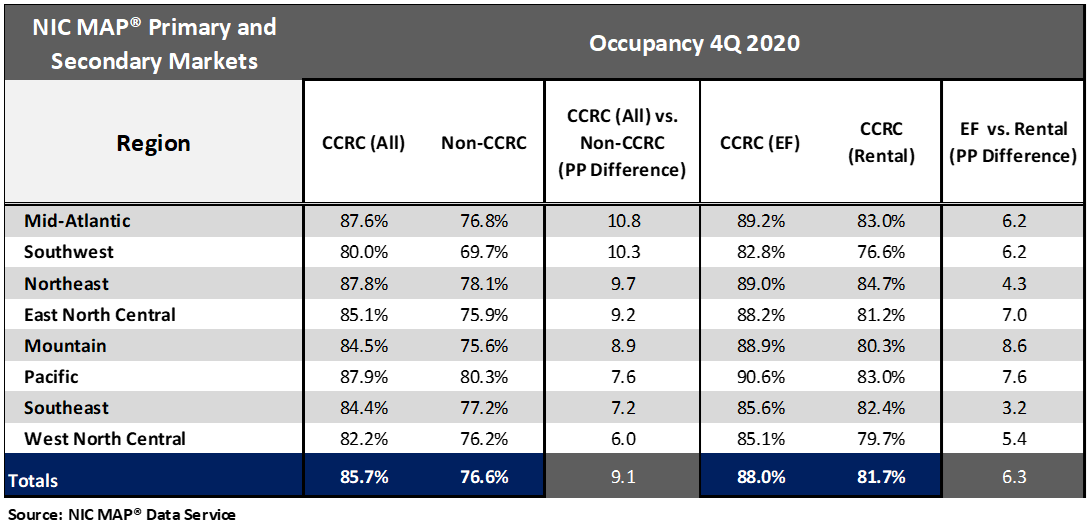
Seniors housing and care communities in the Pacific, Northeast, and Mid-Atlantic regions, which were more significantly impacted earlier in the pandemic than other regions, currently have the strongest CCRC occupancy rates ranging from 87.9% to 87.6%. The weakest CCRC and non-CCRC occupancy is in the Southwest region at 80.0% and 69.7%, respectively. That said, the greatest difference in CCRC and non-CCRC occupancy was in the Mid-Atlantic region—a 10.8 percentage point difference.
The difference in fourth quarter occupancy rates between entrance fee and rental CCRCs was the greatest in the Mountain region (8.6 percentage points), followed by the Pacific (7.6 percentage points), and the East North Central region (7.0 percentage points).
Looking specifically at the independent living care segment by payment type, the difference in fourth quarter occupancy rates between entrance fee and rental CCRCs was the greatest in the Pacific region (8.0 percentage points), followed by the West North Central region (7.1percentage points), and the Mountain region (7.0 percentage points).
Look for future blog posts from NIC to delve deep into the performance of CCRCs.
To learn more about NIC MAP® Data Service, and the latest metro-level data they can provide to support your organization through their various product offerings, schedule a meeting with a product expert today.

Lana Peck, former senior principal at the National Investment Center for Seniors Housing & Care (NIC), is a seniors housing market intelligence research professional with expertise in voice of customer analytics, product pricing and development, market segmentation, and market feasibility studies including demand analyses of greenfield developments, expansions, repositionings, and acquisition projects across the nation. Prior to joining NIC, Lana worked as director of research responsible for designing and executing seniors housing research for both for-profit and nonprofit communities, systems and national senior living trade organizations. Lana’s prior experience also includes more than a decade as senior market research analyst with one of the largest senior living owner-operators in the country. She holds a Master of Science, Business Management, a Master of Family and Consumer Sciences, Gerontology, and a professional certificate in Real Estate Finance and Development from Massachusetts Institute of Technology (MIT).
Connect with Lana Peck