Seniors Housing Market Fundamentals Show Improvement in Demand.
NIC MAP Vision clients, with access to NIC MAP® data, attended a webinar in mid-October on key seniors housing data trends during the third quarter of 2021. Findings were presented by the NIC Analytics research team. Key takeaways included the following:
Takeaway #1: Record High Demand in 3Q 2021
- Demand, as measured by the change in occupied inventory or net absorption, rebounded in the third quarter of 2021, increasing by 12,318 units in the Primary Markets, the strongest unit increase since NIC MAP Vision began reporting the data in 2005. Prior to the third quarter, the strongest quarterly increase occurred in the third quarter of 2019 (5,242 units). Combined with the second quarter (3,364 units), net absorption has increased by 15,682 units.
- Notably, this is a clear reversal from the loss of 42,344 units during the pandemic in the second, third, and fourth quarters of 2020 and the first quarter of 2021.
- As a result of greater net absorption, the total number of occupied units were close to its year-earlier level in the third quarter of 2020.
Takeaway #2: Occupancy Increased for Both Independent Living and Assisted Living in 3Q 2021
- Assisted living occupancy increased to 76.9% in the third quarter, up from its pandemic low of 75.4% in the first quarter of 2021, but still below its pre-pandemic level of 85.0% in the first quarter of 2020. Independent living occupancy increased to 83.2%, up from its pandemic low of 81.8%in the first quarter of 2021 but still below its pre-pandemic level of 89.7%.
Takeaway #3: Not-for-Profits Continued to Have Higher Occupancy Rates
- Not-for-profit properties consistently have higher occupancy rates than for-profits and this remained the case during the pandemic. Part of the explanation for this is that the not-for-profits often include Continuing Care Retirement Communities (CCRCs) or Life Planning Communities (LPCs) and CCRCs tend to attract residents that are younger and less frail and who typically reside in independent living often creating a longer length of stay. CCRCs also may have had more ability to segregate vulnerable populations than smaller properties.
- From pre-pandemic occupancy to the low point in 1Q 2021, the occupancy rate for the for-profits fell 9.7 percentage points, a full 3.2 percentage points more than the not-for-profits. And at 86.4%, the occupancy rate for the not-for-profits was 9.1 percentage points higher than for the for-profit cohort of properties (77.4%).
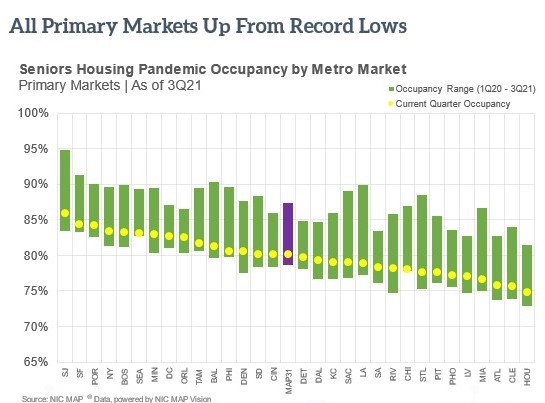
Takeaway #4: All Primary Markets Occupancy Rates Up from Record Lows
- The chart below provides perspective on recovery patterns from the pandemic low by metropolitan market. The yellow dot shows the seniors housing occupancy rate in 3Q 2021, and the top of the green bar shows the 1Q 2021 occupancy rate and the bottom of the green bar shows the 1Q 2021 low point.
- All markets are above their low occupancy levels. The market with the highest 3rd quarter occupancy rate was San Jose at 85.9%, followed by San Francisco, Portland, New York, and Boston. And the lowest occupied markets were Houston at 74.8%, Cleveland, Atlanta, and Miami. There is an 11.1 percentage point wide gap between the best and worst performing markets.
- Regarding improvements from their respective low points, Riverside and Denver both saw a better than 3 percentage point increase in occupancy, followed by Minneapolis, Dallas, and San Jose. The smallest improvement occurred in Chicago, Seattle, and Philadelphia.
- For perspective, the Primary Market occupancy rate was 80.1% and it saw a 1.4 percentage point improvement.
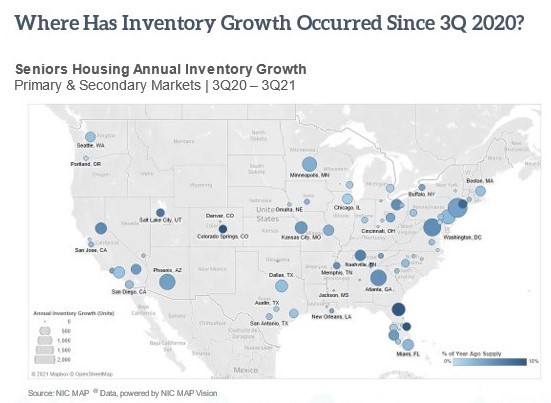
Key Takeaway #5: Where Has Inventory Growth Occurred Since 3Q 2020?
- This map shows inventory growth by market for 99 markets which include the NIC MAP Primary 31 and Secondary 68 markets. The size of the circle shows the level of activity, while the color of the circle shows inventory growth relative to the size of inventory one year ago.
- The largest increase in inventory from year-earlier levels as of the third quarter of 2021 occurred in New York, followed by Washington, D.C., Atlanta, Phoenix, Minneapolis, and Philadelphia, all with more than 1,000 units coming online.
Interested in learning more?
- While the full key takeaways presentation is only available to NIC MAP clients with access to NIC MAP data, you can access the abridged version of the 3Q21 Data Release Webinar & Discussion featuring my exclusive commentary below.

- To learn more about NIC MAP data, powered by NIC MAP Vision, an affiliate of NIC, and accessing the data featured in this article, schedule a meeting with a product expert today.
About Beth Mace
Beth Burnham Mace is a special advisor to the National Investment Center for Seniors Housing & Care (NIC) focused exclusively on monitoring and reporting changes in capital markets impacting senior housing and care investments and operations. Mace served as Chief Economist and Director of Research and Analytics during her nine-year tenure on NIC’s leadership team. Before joining the NIC staff in 2014, Mace served on the NIC Board of Directors and chaired its Research Committee. She was also a director at AEW Capital Management and worked in the AEW Research Group for 17 years. Prior to joining AEW, Mace spent 10 years at Standard & Poor’s DRI/McGraw-Hill as director of its Regional Information Service. She also worked as a regional economist at Crocker Bank, and for the National Commission on Air Quality, the Brookings Institution, and Boston Edison. Mace is currently a member of the Institutional Real Estate Americas Editorial Advisory Board. In 2020, Mace was inducted into the McKnight’s Women of Distinction Hall of Honor. In 2014, she was appointed a fellow at the Homer Hoyt Institute and was awarded the title of a “Woman of Influence” in commercial real estate by Real Estate Forum Magazine and Globe Street. Mace earned an undergraduate degree from Mount Holyoke College and a master’s degree from the University of California. She also earned a Certified Business Economist™ designation from the National Association of Business Economists.
Connect with Beth Mace
Read More by Beth Mace