
Insights in Seniors Housing & Care
NIC MAP® Data Service clients attended a webinar earlier this month on the key seniors housing data trends during the fourth quarter of 2017. Key takeaways included the following.
The all occupancy rate for seniors housing, which includes properties still in lease up, was 88.8% in the fourth quarter, unchanged from the third quarter. This placed occupancy 1.8 percentage points above its cyclical low of 87.0%, reached during the first quarter of 2010, and 1.4 percentage points below its most recent high of 90.2% in the fourth quarter of 2014. For the year, 18,500 units were added to inventory compared with 12,200 units absorbed on a net basis. As a result, occupancy fell 70 basis points from the fourth quarter of 2016.

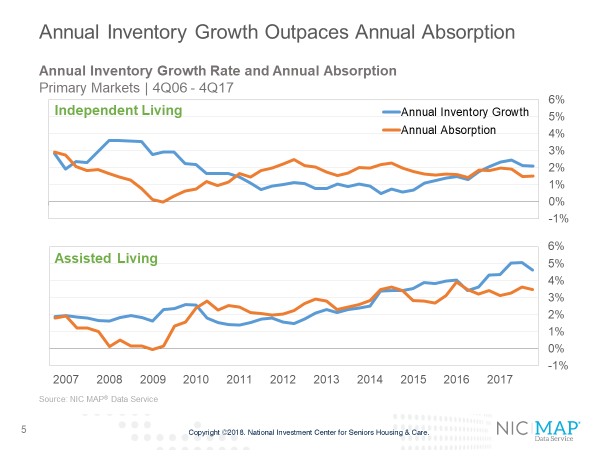
Assisted living inventory growth has been ramping up for a longer period than independent living in the primary markets. In mid-2012, the occupancy rate of independent living was nearly the same as for assisted living at 88.8%. Since that time, there has been a clear divergence in occupancy performance reflecting the differences in supply growth and demand for the two property types.
For majority independent living properties, inventory growth exceeded absorption by 60 basis points in the fourth quarter—2.1% versus 1.5%. The occupancy rate for majority independent living properties was 90.6% in the fourth quarter. Annual inventory growth for majority assisted living properties was 4.6%, down a bit from the third quarter. Annual absorption slipped back to a pace of 3.6%. The occupancy rate for assisted living was 86.5% in the fourth quarter.
During the past three years, there have been nearly 79,000 units added to the stock of seniors housing inventory among the primary and secondary markets. Nearly one-third of this growth occurred in eight metro areas: Dallas, Minneapolis, Chicago Atlanta, Houston, Boston, Phoenix, and New York. Dallas alone accounted for 5% of all new seniors housing inventory in the past three years.
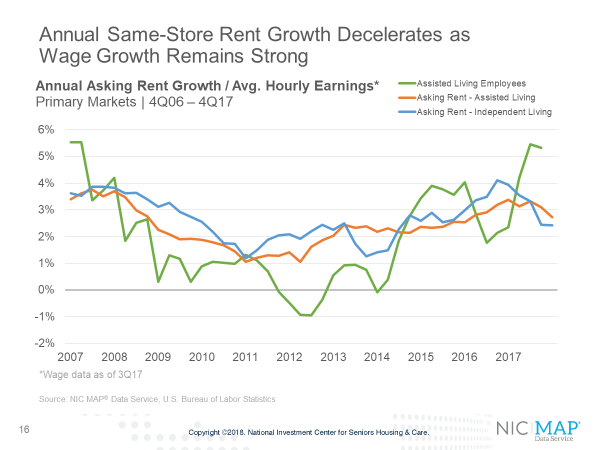
Same-store asking rent growth for seniors housing slowed in the fourth quarter, with year-over-year growth of 2.6%. This was down from 3.7% in the fourth quarter of last year when it reached a cyclical peak, but was equal to its long-term average pace experienced since late 2006 of 2.6%.
Asking rent growth for majority assisted living properties was 2.7% in the fourth quarter, down 40 basis points from the third quarter. For majority independent living, rent growth remained at its third quarter pace of 2.4%, but was well below the 4.1% pace it achieved in the third quarter of 2016 when rent growth reached its highest pace since NIC began collecting this data.
There is wide variation in rent growth. Among the primary markets, the top ranked metropolitan areas for year-over-year rent growth in seniors housing were San Jose, Seattle, Los Angeles, Las Vegas and Portland, Oregon. The weakest rent growth was in Kansas City, Atlanta, Chicago and San Antonio. Many of these latter markets also had some of the lowest fourth quarter occupancy rates in the nation.
Beth Burnham Mace is a special advisor to the National Investment Center for Seniors Housing & Care (NIC) focused exclusively on monitoring and reporting changes in capital markets impacting senior housing and care investments and operations. Mace served as Chief Economist and Director of Research and Analytics during her nine-year tenure on NIC’s leadership team. Before joining the NIC staff in 2014, Mace served on the NIC Board of Directors and chaired its Research Committee. She was also a director at AEW Capital Management and worked in the AEW Research Group for 17 years. Prior to joining AEW, Mace spent 10 years at Standard & Poor’s DRI/McGraw-Hill as director of its Regional Information Service. She also worked as a regional economist at Crocker Bank, and for the National Commission on Air Quality, the Brookings Institution, and Boston Edison. Mace is currently a member of the Institutional Real Estate Americas Editorial Advisory Board. In 2020, Mace was inducted into the McKnight’s Women of Distinction Hall of Honor. In 2014, she was appointed a fellow at the Homer Hoyt Institute and was awarded the title of a “Woman of Influence” in commercial real estate by Real Estate Forum Magazine and Globe Street. Mace earned an undergraduate degree from Mount Holyoke College and a master’s degree from the University of California. She also earned a Certified Business Economist™ designation from the National Association of Business Economists.
Connect with Beth Mace