Its Local, local, local. Seniors housing market fundamentals are not the same for all markets as local development and demand situations shape conditions. In the first quarter of 2017, pronounced differences in occupancy rates could be seen by both property type and geography. By property type at the national level, there was a 370 basis point difference between majority assisted living and majority independent living occupancy rates (87.2% versus 90.9%)—the largest differential in the two data series since NIC began collecting the data in 2005. By geography, the differences were even wider. For assisted living, occupancy rates ranged from nearly 93% in San Jose to less than 72% in San Antonio. For independent living, the gap between best and worst market was narrower, with Houston ranking lowest at 83% and San Jose maintaining its rank as strongest with a 96% occupancy rate in the first quarter. The balance of this blog post will look at these differences in more depth.
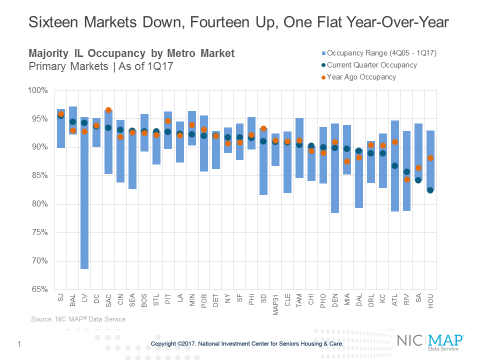
Among the 31 NIC MAP® Primary Markets, four reached near-record high occupancy rates for majority independent living properties in the first quarter of 2017—Seattle, St. Louis, Chicago and Dallas—while two reached record lows[1]— Houston and San Antonio. Meanwhile, San Jose boasted the highest occupancy rate for independent property types in the first quarter. San Jose was followed by Baltimore, Las Vegas, Washington, D.C. and Sacramento. Three of these markets—San Jose, Sacramento and Baltimore—also ranked in the top five most occupied markets for assisted living, with San Jose garnering top spot again. At the opposite end of the spectrum were the more poorly occupied independent living markets of Houston, San Antonio, Riverside, Atlanta and Kansas City. Two of these had the lowest occupancy for assisted living as well—San Antonio and Kansas City. As with all real estate, location and timing are everything.
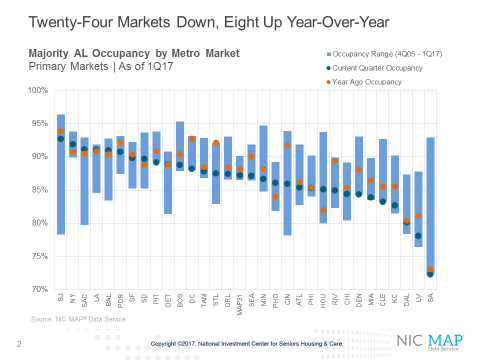
Other notable observations of market performance include the 14 majority independent living markets that experienced gains in occupancy in the first quarter of 2017 from year-earlier levels (versus eight for assisted living). This compares to the 16 markets that saw a decline in independent living occupancy from year-earlier levels (versus 23 for assisted living).
A few other markets had record or near-record low assisted living occupancy rates in the first quarter as well. These include:
There were also a number of markets that saw significant deterioration in assisted living occupancy rates in the past year. Worse among these was:
At the other end of the spectrum, eight markets experienced gains in assisted living occupancy over the past year. This list includes Houston (up 310 basis points from the first quarter of 2016), followed by Phoenix (up 200 basis points), and New York and San Diego (both up approximately 100 basis points).
Understand Drivers of Supply and Demand. Variation in local market performance is a result of disparate influences, some of which involve supply factors including the ease of development, the cost and availability of debt and equity sources of financing. On the demand side, determinants can include consumer-familiarity with the product offerings, demographic growth drivers and local market economic conditions. A solid understanding of supply and demand determinants and how these conditions translate into performance measurements can make the difference between a successful and a less successful operation.
[1] Record high or record low during the period that NIC has been reporting this data: Q4 2005 to Q1 2017