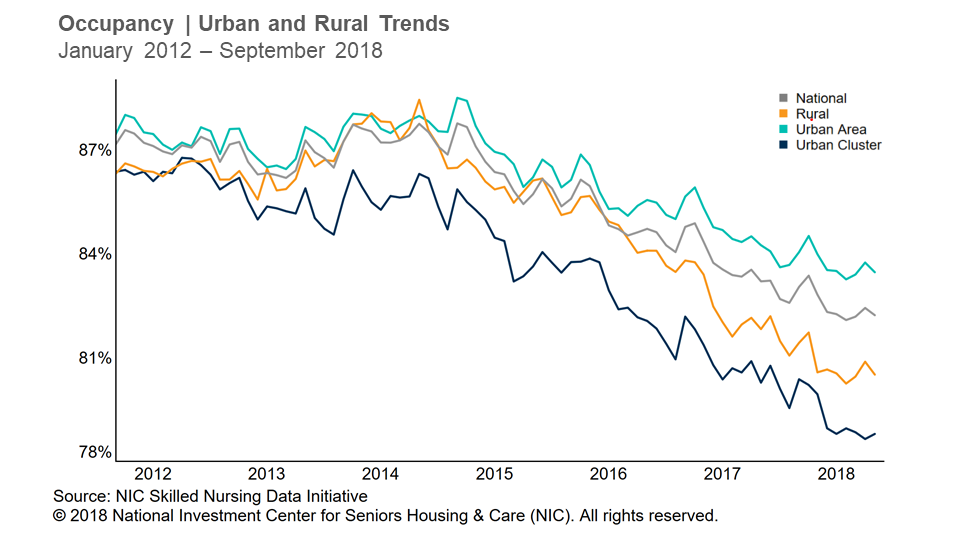
- Occupancy Edged Up To 82.2% in Q3 2018
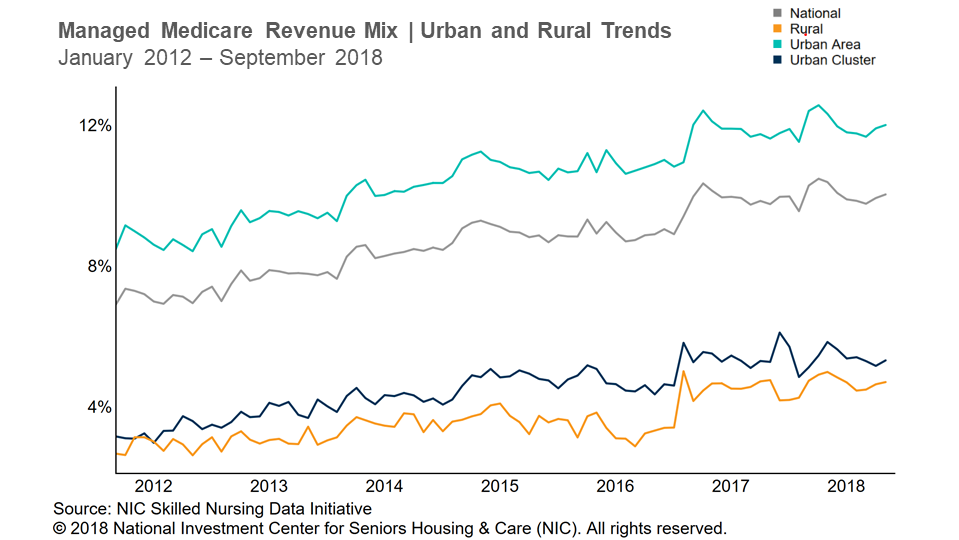
- Managed Medicare Revenue Mix Reached 10%
NIC released its third quarter 2018 Skilled Nursing Data Report last week, which includes key monthly data points from January 2012 through September 2018. The report also includes the latest urban vs. rural comparative data points as well as revenue mix trends.
Here are some key takeaways from the report:
- Overall occupancy increased 14 basis points to 82.2% in the third quarter but was nearly a full percentage point below year-earlier levels. The quarterly increase is notable because occupancy has declined or been flat between the second and third quarters for the past three years. Occupancy trended up quarter-over-quarter in both urban and rural areas, but it was down in urban clusters.
- Medicaid patient day mix increased to a time-series high of 66.7% in the third quarter. The combination of this and the relatively steady performance in private patient day mix help to explain the third quarter occupancy trend. The Medicaid patient day mix increase was driven by urban areas which rose to a time-series high of 67.9%. Private patient day mix held relatively steady overall. Private mix in rural areas was up from the prior quarter and year-earlier levels but still down by 188 basis points over the last five years. Urban areas showed a decrease from the prior quarter and from a year ago.
- Managed Medicare patient day mix increased 7 basis points from the second quarter of 2018 to 6.5%. However, the increase appears to be moderating because it was only up 13 basis points compared to one year ago. The relatively small increase from last year was driven by urban areas, up 22 basis points, as rural areas were slightly down. At 10%, managed Medicare revenue mix was up quarter-over-quarter and year-over-year. Managed Medicare now represents 12% of revenue in urban areas, but only 4.7% in rural areas. However, it has grown over the past few years in rural areas, albeit slowly.
- Medicaid revenue mix reached a time-series high of 50.5% in the third quarter 2018, up 88 basis points from the second quarter of 2018 and up 162 basis points from a year ago. The quarterly revenue trend is driven by the urban areas, just like the Medicaid patient day mix, as rural area Medicaid revenue mix was down from the prior quarter. Although the lowest payor, in terms of revenue per patient day (RPPD), Medicaid RPPD grew at the fastest pace over the past year relative to the other payor types in this data set, rising by 2.0%.
About Bill Kauffman
Senior Principal Bill Kauffman works with the research team in providing research and analysis in various areas including sales transactions and skilled nursing. He has lead roles in creating new and enhanced products and implementation of new processes. Prior to joining NIC he worked at Shelter Development in investing/acquiring, financing, and asset management for over $1 billion in assets. He also had key roles in the value creation and strategic planning and analysis for over 65 entities. He received his Bachelor of Business Administration in Finance from the College of Business and Economics at Radford University and his Master of Science in Finance from Loyola College in Maryland. He also holds the Chartered Financial Analyst Designation (CFA).
Connect with Bill Kauffman
Read More by Bill Kauffman
