In recent blog posts, I’ve given you a “deep dive” into the seniors housing markets in the Southeast, California and Texas. Today, I’ll provide a high level look at the seniors housing market in the Northeast. For an even deeper dive, check out the original article in the May edition of the NIC Insider Newsletter.
The Economy. There are six large metropolitan markets among the 31 NIC MAP® Primary Markets in the Northeast. They include Baltimore, Boston, New York, Philadelphia, Pittsburgh and Washington, D.C.
- The six Northeastern metropolitan markets make up 13% of the nation’s job base.
- Boston, New York, Philadelphia and Washington, D.C. had job growth that exceeded the national annualized pace of 1.6% in January 2017.
- Labor market conditions are tight.
- The combination of tight labor markets and rising minimum wage rates in both Washington, D.C. and Boston will put pressure on expense growth for many operators of seniors housing and care properties.
Seniors Housing Data. In terms of seniors housing, a full 25% of the seniors housing unit inventory within the 31 Primary Markets is situated in the densely-populated metropolitan areas of Baltimore, Boston, New York, Philadelphia, Pittsburgh and Washington, D.C.
Limited Construction. Much like California’s coastal markets, these six metropolitan areas are generally perceived to be markets with significant entitlement, regulatory or physical constraints for new development. The effects of limited development opportunities can be seen in the relatively low ratios of construction as a share of inventory in these six markets.
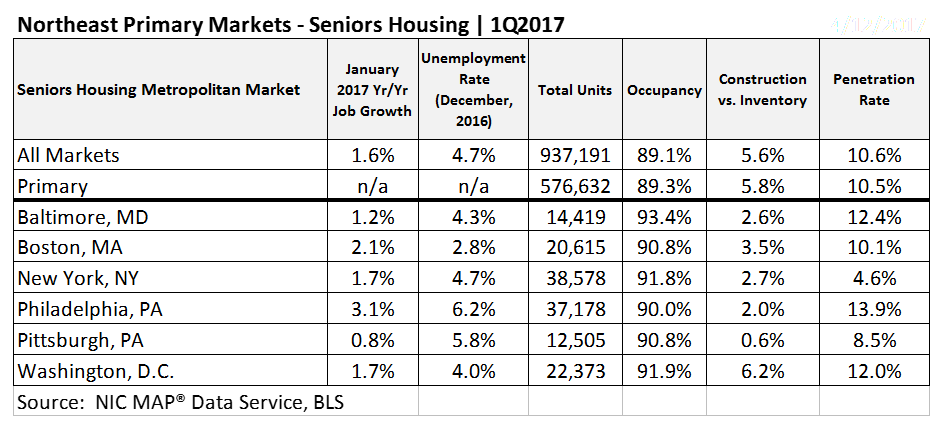
- Only one market—Washington, D.C.—exceeded the 5.6% ratio of construction as a share of inventory.
- In aggregate, the six Northeast markets had 13% of all construction in the Primary Markets compared with 25% of the inventory.
High Occupancy Rates. Due to supply and demand conditions, occupancy rates are high in the Northeast.
- All six markets exceeded the Primary Market average of 89.3% in the first quarter of 2017.
- The strongest occupancy rate was in Baltimore at 93.4%, followed by Washington, D.C., New York, Pittsburgh and Boston.
- Philadelphia trailed the pack at 90.0%.
Penetration Rates. High penetration rates do not necessarily translate into high occupancy rates, nor do high occupancy rates and low penetration rates.
- New York had a first quarter occupancy of 91.8%, above the primary market average of 89.3%, yet had a penetration rate of only 4.6%.
- Baltimore had an occupancy rate of 93.4%, yet a penetration rate of 12.4%.
- Pittsburgh had an occupancy rate of 90.8% and a penetration rate of 8.5%.
- Cultural factors as well as lifestyle choices, familiarity with seniors housing options as an alternative to living at home, operator mix and unit mix, and demographic characteristics are all factors that influence penetration rates.
In wrapping up, the key takeaways on current market performance in the Northeast include:
- Generally high occupancy rates
- Generally limited construction
- Variation in penetration rates, and
- Potential occupancy challenges in markets such as Boston and Washington, D.C.