The NIC Map Data Service recently released national benchmark data through year-end 2016 for actual rates and leasing velocity. Key takeaways include:
- Average initial rates were below average asking rates for both independent living and assisted living properties, with monthly spreads larger for assisted living properties throughout the entire reported period.
- As of December 2016, assisted living initial rates averaged 10.7% below the average asking rate, which equates on an annualized basis to an average initial rate discount equivalent to nearly 1.3 months. The discount for independent living was smaller at less than half a month rent.
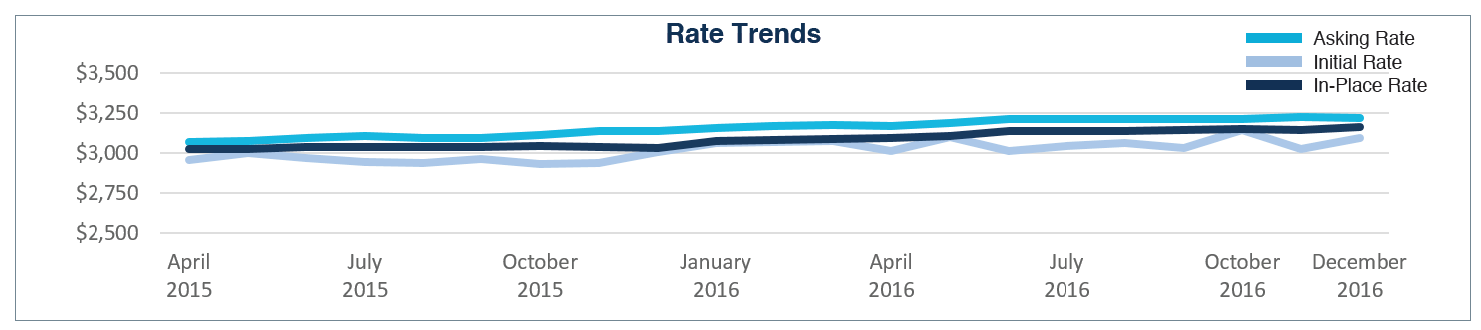
- Average initial rates for independent living properties have been trending higher for the past 12 months, and in December, were 2.9% above year-earlier levels. This was more than the 2.5% increase seen in average asking rates for independent living. While assisted living average asking rates also continued to climb, average initial rates for assisted living were 1.2% below year-earlier levels.
- Average in-place rates exceeded average initial rates for assisted living in every month of the past year, and were 6.2% higher on average. In-place rates were also higher on average for independent living properties, but the differences were smaller than for assisted living at 2.0% for the past twelve months.
- The pace of move-outs continues to be greater for assisted living than independent living. This demonstrates that resident turnover continues to be greater within assisted living properties than independent living properties. Move-outs have exceeded move-ins for six of the past twelve months for assisted living and five months for independent living.
The NIC MAP Seniors Housing Actual Rates Report provides national data from approximately 250,000 units within more than 2,500 properties across the U.S. operated by 15 to 20 seniors housing providers. This monthly time series is comprised of end-of-month data for each respective month.