
Insights in Seniors Housing & Care
The Southeast is a vibrant and expanding region of the U.S., both for job seekers and business owners. This region, which includes Florida, Georgia, Mississippi, Alabama, and Tennessee, attracts older and younger people alike, who are drawn by the warmer climate, retirement destinations, business connections, cultural offerings, recreational opportunities, and broad-based growth potential.
In today’s blog post, I’ll give you a high-level look at the seniors housing market in the Southeast. For a deeper dive, be sure to check out the original article in the December/January edition of the NIC Insider Newsletter.
The Data
An estimated 14% of the U.S. population—some 45 million people—live in the Southeast. Its population historically has grown at a faster pace than the nation’s, expanding by 5.5% since 2010 compared to the national growth rate of 4.1% and accounting for 19% of the entire nation’s population growth. Projections from the U.S. Census Bureau suggest that this region of the country will continue to expand at a faster pace than the nation as a whole.
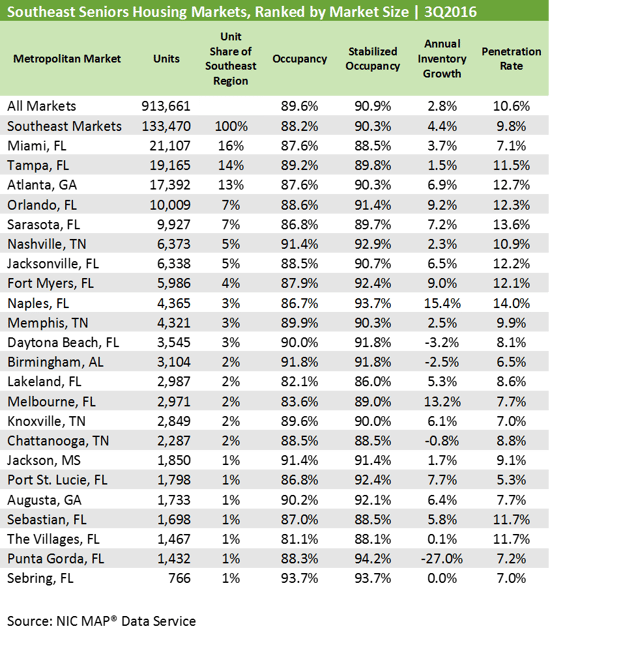
The Southeast region makes up 14% of the NIC MAP® Data Service’s seniors housing inventory. NIC MAP tracks 23 Southeast markets, which include 133,000 units situated in 1,086 properties. Here’s a breakdown of NIC MAP data and analysis for the region as of the third quarter of 2016:
 Other Factors in Play in the Southeast
Along with occupancy, these factors are important to consider when looking at the Southeast’s seniors housing market:
Hear the Latest Trends
Get critical insight into the seniors housing and skilled nursing markets at the 2017 NIC Spring Investment Forum, March 22-24 in San Diego. Make new business connections and discover strategies for creating value through collaborations across the real estate and non-real estate-based continuum of care. Register today!
[hubspot_cta id='924a5771-df04-4b07-91db-ac8b91268159']
Beth Burnham Mace is a special advisor to the National Investment Center for Seniors Housing & Care (NIC) focused exclusively on monitoring and reporting changes in capital markets impacting senior housing and care investments and operations. Mace served as Chief Economist and Director of Research and Analytics during her nine-year tenure on NIC’s leadership team. Before joining the NIC staff in 2014, Mace served on the NIC Board of Directors and chaired its Research Committee. She was also a director at AEW Capital Management and worked in the AEW Research Group for 17 years. Prior to joining AEW, Mace spent 10 years at Standard & Poor’s DRI/McGraw-Hill as director of its Regional Information Service. She also worked as a regional economist at Crocker Bank, and for the National Commission on Air Quality, the Brookings Institution, and Boston Edison. Mace is currently a member of the Institutional Real Estate Americas Editorial Advisory Board. In 2020, Mace was inducted into the McKnight’s Women of Distinction Hall of Honor. In 2014, she was appointed a fellow at the Homer Hoyt Institute and was awarded the title of a “Woman of Influence” in commercial real estate by Real Estate Forum Magazine and Globe Street. Mace earned an undergraduate degree from Mount Holyoke College and a master’s degree from the University of California. She also earned a Certified Business Economist™ designation from the National Association of Business Economists.
Connect with Beth Mace