Insights in Seniors Housing & Care
Seniors housing properties are aging, and senior consumer tastes are changing. Strong inventory growth in recent years has brought to market new competition for existing buildings—most built prior to the Great Recession. Which markets have the oldest and newest seniors housing stock? Is there a “sweet spot” in terms of building age and occupancy performance? And, what are some of the factors that contribute to strong occupancy in older buildings? To provide food for thought and possible answers to these questions, this commentary dives into the NIC MAP® data for the 31 Primary Markets to explore potential relationships between age and occupancy by geography.[1]
Which markets have the oldest seniors housing properties?
The chart below ranks the average age of seniors housing properties by geography for the 31 Primary Markets as of the third quarter of 2019. The youngest markets, as measured by the average age of the properties in the CBSA, are indicated by blue bars (Minneapolis to Boston), and the oldest are indicated by gold bars (Los Angeles to Tampa).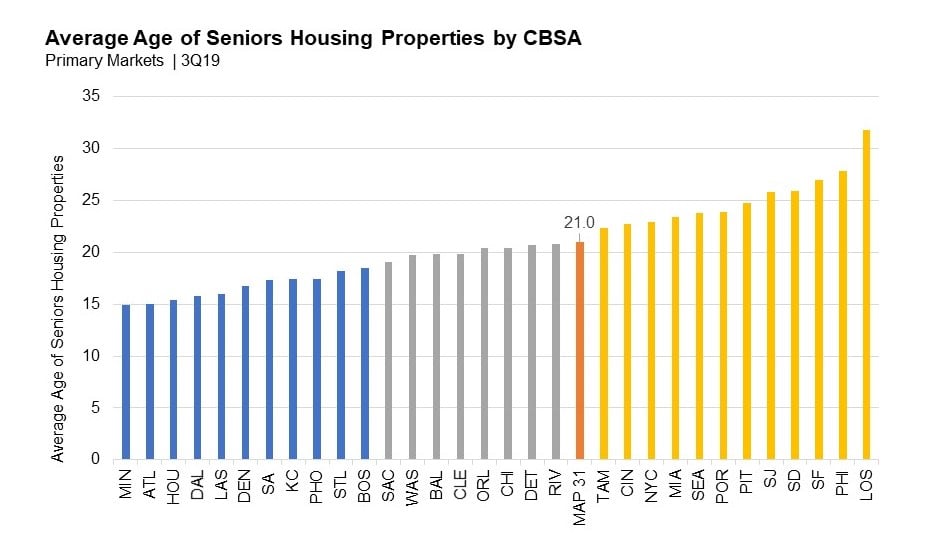
Source: NIC MAP® Data Service
In the third quarter, the average age of seniors housing properties in the Primary Markets (denoted by the orange bar) was 21 years old. Minneapolis, Atlanta and Houston had the lowest average age (15 years). Not surprisingly, the markets with the youngest properties also had the most recent inventory growth. Indeed, of the eleven markets with the lowest average age, nine had net inventory growth of 15% or more over the past three years. Two of these markets, Atlanta and Las Vegas, had net inventory growth of 26% and 21%, respectively. This compares with 10% for the Primary Markets.
Los Angeles had the oldest seniors housing properties (averaging 32 years old), followed by Philadelphia, San Francisco, San Diego, San Jose and Pittsburgh (ranging from an average of 28 years to 25 years old). Older markets reported lower rates of net inventory growth, and each of these markets saw growth of 4% or less over the past three years.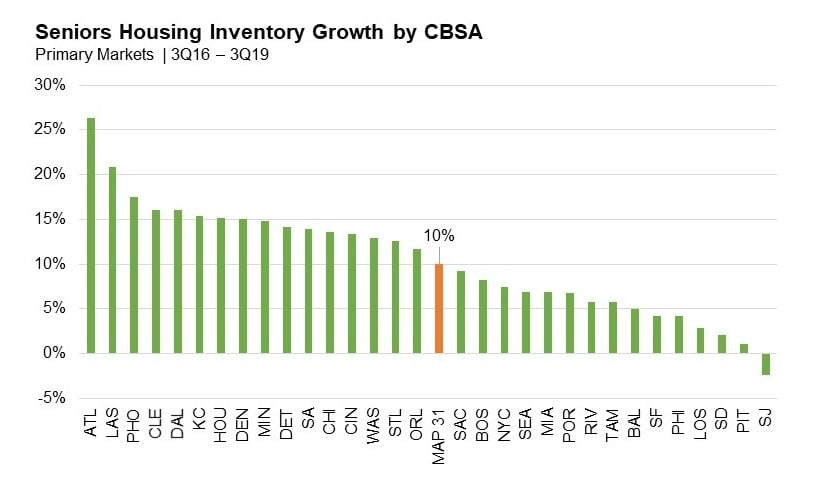
Source: NIC MAP® Data Service
Is there a relationship between a market’s average property age and occupancy?
Conventional wisdom suggests that senior living consumers are attracted to move into new construction with fresh finishes and amenities, and contemporary design. But are these assumptions consistent with the data? The chart below explores the relationship between the average occupancy of seniors housing properties and average age by geography. The Primary Market average age for seniors housing properties was 21 years old as of the third quarter of 2019, and the overall average occupancy rate was 88.0%. The youngest eleven markets are shown to the left of the Primary Market average, and the oldest twelve are shown to the right.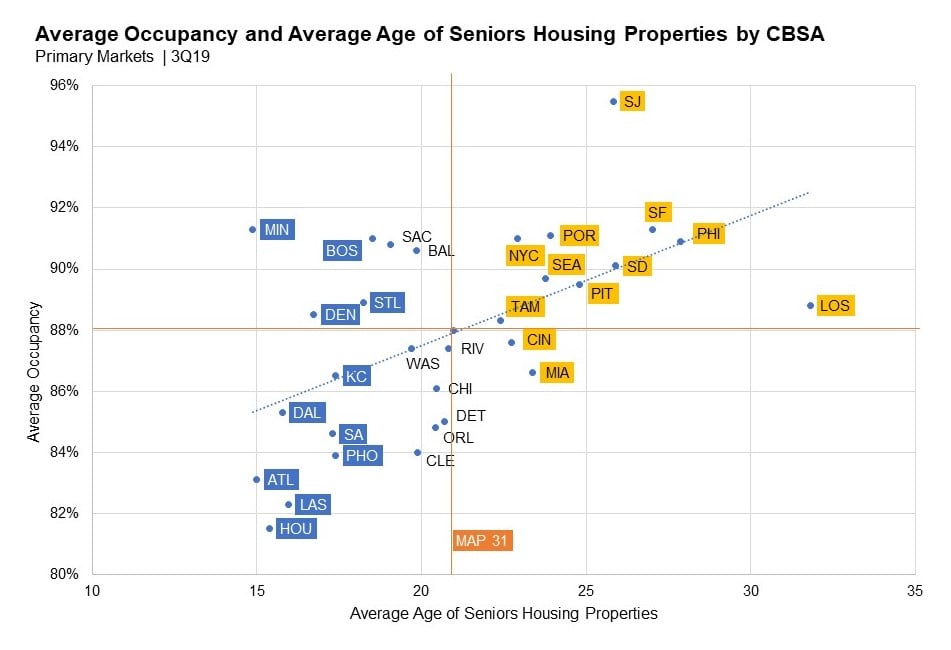
Source: NIC MAP® Data Service
Contrary to a prevailing assumption that newer properties should garner higher occupancy rates than older properties, there is a notable link between older average age and higher average occupancy—in fact, some of the oldest markets—including San Jose, San Francisco, Portland, New York City, and Philadelphia—had among the highest average seniors housing occupancy rates across the Primary Markets. Compared to markets with newer properties, which showed a weaker connection between average age and average occupancy, older markets had higher than average stabilized occupancy, lower than average rates of annual net absorption (i.e., less change in occupied stock), and lower than average rates of annual net inventory growth.
Is there an occupancy “Sweet Spot?”
Seniors housing has weathered an acceleration of inventory growth over the past several years, which has put downward pressure on occupancy in many metropolitan areas. But, do seniors housing buildings have a “sweet spot” in terms of occupancy performance?
Across the 31 Primary Markets, nineteen reported the highest average occupancy in the 10- to 17-year age grouping, and five in the 25-years or more age grouping. The chart below displays the average seniors housing “all” occupancy rate by age group in the third quarter for the Primary Markets in aggregate, Philadelphia—which exemplifies an older market with above-average occupancy—and Houston, which exemplifies a younger market with below-average occupancy.
As illustrated, in all three instances, the 10- to 17-year age grouping, followed by properties over 25 years old, outperformed the other age groupings in terms of average occupancy. For the Primary Markets, those occupancy rates were 91.6% and 90.6%, respectively. For Philadelphia, those occupancy rates were 93.9% and 91.9%, and for Houston, 85.1% and 85.1%.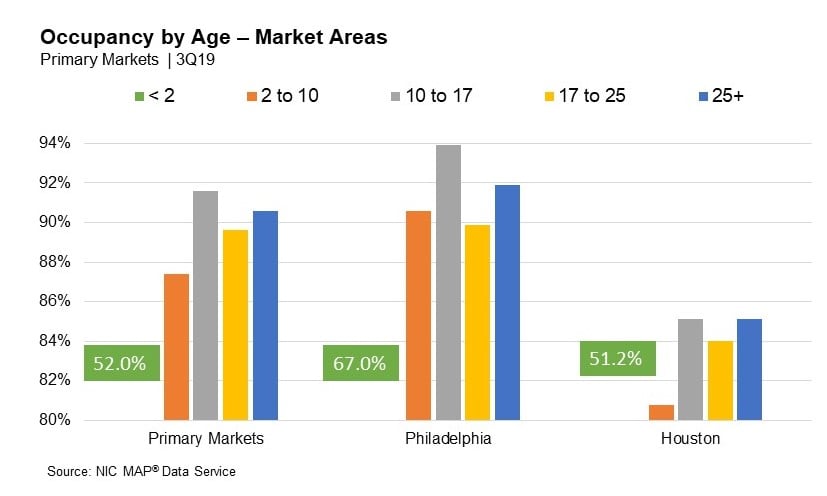
Considering the proportion of units by age for each of the three examples, Philadelphia’s overall occupancy rate (90.9%) was buoyed by properties between 10 to 17 and 25+ years old, which represented just under three-quarters of all existing units. Houston’s overall occupancy rate (81.5%), on the other hand, was dragged down by properties less than 10 years old, which represented nearly a third of all existing units.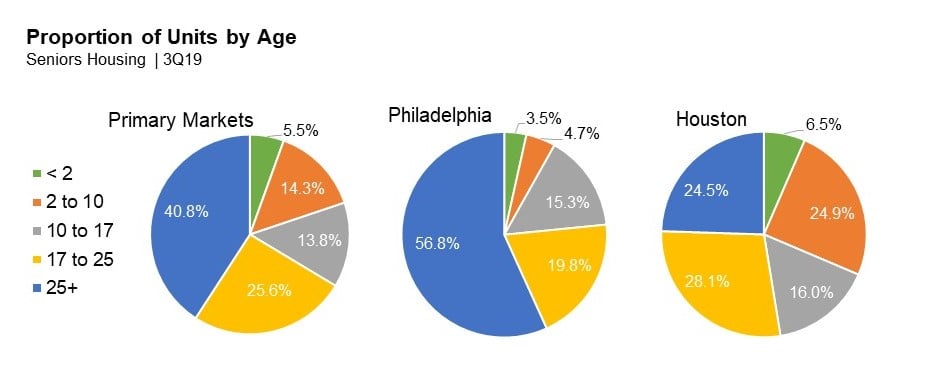
Source: NIC MAP® Data Service
Why does it appear that the “sweet spot” for building occupancy is in the 10- to 17-year age range? Is it possible that by this time in a property’s life, operators had built strong reputations in and around the neighborhoods they serve? Had they mastered staffing and other operational efficiencies translating into high levels of resident satisfaction that augment word-of-mouth marketing power? Or had they perhaps begun to spend earmarked maintenance and revenue-enhancing capital expenditure dollars to improve, refurbish, or reposition units or common spaces within buildings for higher and better use—all of which may allow them to build or maintain market share, and effectively compete with the latest offerings?
As the NIC MAP data indicate, on one hand, markets with the youngest seniors housing stock generally had seen recent, and in some instances ongoing, high levels of inventory growth, coupled with lower average occupancy rates, and greater competition resulting from supply and demand imbalances. On the other hand, markets with older seniors housing stock generally had maintained strong occupancy rates, in part due to barriers to entry keeping inventory growth in check, and higher levels of stabilized occupancy.
In analyzing the 31 Primary Markets, the NIC MAP data revealed that the strongest average occupancy performance was most frequently seen in the 10- to 17-year age range. Possible reasons for higher average occupancy among older properties are multi-faceted and market specific. As seniors housing properties age, the capex burden naturally increases, and industry data suggest that capital expenditures begin to accelerate around year 10 of a building life. It is possible that capital expenditures for refreshing an older property may be encouraged by new supply, and sustained expenditures may allow an older property to boost or maintain its occupancy for many years. Unspent or unwisely spent capex could result in diminished returns, so it is important for operators to appropriately time and budget expenditures based on their unique market conditions.
[1] Note that the property age data tracked by NIC is based on the date in which the building was originally opened. That said, if a building was torn down and subsequently rebuilt, the property’s age would reflect the new building open date. However, the age of a property is not adjusted for expansions or repositioned units, which are considered part of the original building.
###
Lana Peck, former senior principal at the National Investment Center for Seniors Housing & Care (NIC), is a seniors housing market intelligence research professional with expertise in voice of customer analytics, product pricing and development, market segmentation, and market feasibility studies including demand analyses of greenfield developments, expansions, repositionings, and acquisition projects across the nation. Prior to joining NIC, Lana worked as director of research responsible for designing and executing seniors housing research for both for-profit and nonprofit communities, systems and national senior living trade organizations. Lana’s prior experience also includes more than a decade as senior market research analyst with one of the largest senior living owner-operators in the country. She holds a Master of Science, Business Management, a Master of Family and Consumer Sciences, Gerontology, and a professional certificate in Real Estate Finance and Development from Massachusetts Institute of Technology (MIT).
Connect with Lana Peck