
Insights in Seniors Housing & Care
By: Beth Burnham Mace and Anne Standish | March 31, 2021
A lot of attention has been paid to the occupancy challenges that seniors housing operators have faced since the COVID-19 pandemic began in early 2020. This blog focuses on the impact of the pandemic on occupancy by operator size. We conclude that single-property operators generally saw smaller occupancy declines during 2020 than very large operators. New supply, as well as pandemic-related changes in the rates of move-ins and move-outs, contributed to this disparity.
Methodology. NIC Analytics utilized NIC MAP® Data, powered by NIC MAP Vision, for this analysis. We examined occupancy patterns among single-property operators, small-sized operators (2–4 properties), medium-sized operators (5–9 properties), large operators (10–24 properties), and very large operators (25 and more properties).
This analysis uses majority property type. Majority property type is the industry’s traditional categorization where each property is classified by its plurality care segment (referenced as majority) and where memory care is considered a subset of assisted living. Seniors housing is defined as the aggregate of majority independent living and majority assisted living. Properties are categorized by their operator’s size in each quarter. Some properties in this analysis have had a change of operator during 2020, so each operator size group per metropolitan market may not be entirely “same store.”
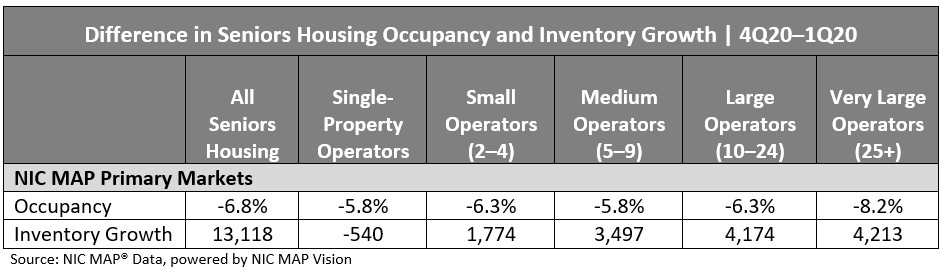
NIC MAP Primary Markets. While deaths, move-outs, and a slowdown in move-ins contributed to decreases in occupancy, new inventory continued to come online during the pandemic, which put further pressure on occupancy rates. For the NIC MAP Primary Markets, net absorption for 2Q20, 3Q20, and 4Q20 was negative for each quarter, with a staggering -33,500 units having been vacated on a net basis and again available. However, net inventory grew by 13,000 units for the same period. The combination of new inventory growth and negative net absorption put enormous pressure on seniors housing occupancy rates, which fell from 87.5% during 1Q20 to 80.7% during 4Q20 for the NIC MAP Primary Markets. The 6.8 percentage point drop in the occupancy rate may not have been as steep, however, had the number of new and unleased units not increased as much.
Findings. Over the course of the pandemic in 2020, single property operators saw the smallest declines in occupancy of the five operator size groups examined for the NIC MAP Primary Markets. Conversely, very large operators saw the greatest declines in occupancy from 1Q20 to 4Q20. Occupancy dropped 5.8 percentage points for single-property operators and 8.2 percentage points for the very large operators within the Primary Markets.
Between 1Q20 and 4Q20, single-property operators experienced negative inventory growth, while very large operators had the largest inventory growth of the five operator categories for the NIC MAP Primary Markets. The inventory decline for single-property operators could be due to a few factors, including that some properties may have been purchased from single-property owner/operators to become owned and operated by larger chains, or there may have been property closures or closures of units or wings at properties that remained open. The additional units coming online during this period put added pressure on occupancy for very large operators in a way that the single property operators did not experience.
Conclusion. This analysis has shown that generally, the very large operators experienced the greatest drops in occupancy during the pandemic of the five selected operator groups. Some of the explanation for this is the inventory growth that occurred for the largest operators.
Additional explanations for the larger drop in occupancy observed for very large operators include that some larger operators may focus more broadly on REVPOR or revenue per occupied unit and, therefore, managing more to asking and actual rates than occupancy levels. It may also be that properties that were operated by single-property operators in 2020 had more flexibility to allow move-ins based on local coronavirus positivity rates, whereas properties operated by larger chains may have had more uniform, organization-wide policies and procedures in place either controlling or restricting move-ins regardless of the level of coronavirus positivity rate by region or locale.
NIC MAP Vision Clients with a NIC MAP Data subscription can access the full version of this analysis in the latest Insights Newsletter by logging into their Client Portal.
About NIC MAP Vision:
NIC MAP Vision is a leading provider of comprehensive market data for the seniors housing and care sector. NIC MAP Vision brings together two strong, well-respected, and complementary teams and platforms – the market-leading NIC MAP® Data Service (NIC MAP) and VisionLTC’s best-in-class market research analysis platform. For more information, visit www.nicmapvision.com.
Not a NIC MAP Vision Client? Learn what NIC MAP can do for you.
Schedule a meeting with a NIC MAP Product Expert to learn more about how our product offerings can help support your business and save you time in an increasingly competitive market.