NIC MAP® Data Service clients attended a webinar in mid-April on the key seniors housing data trends during the first quarter of 2020. Key takeaways included the following:
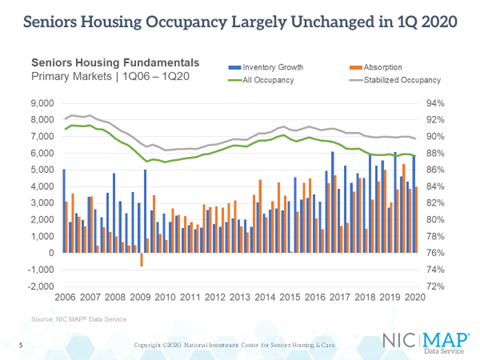
Takeaway #1: Seniors Housing Occupancy Largely Unchanged in 1Q 2020
- The first quarter data does not reflect the effects of the COVID-19 pandemic. It effectively sets the stage at the onset of the pandemic.
- Dating back to late 2017, the seniors housing occupancy rate has been generally flat, with only 10 to 20 basis point changes from one quarter to the next.
- More specifically, the occupancy rate for seniors housing was 87.7% in the first quarter of 2020, down 20 basis points from the fourth quarter of 2019 (87.9%) and from the first quarter of 2019.
- For seniors housing, net absorption (3,078 units in the first quarter), was less than inventory growth (of 4,305 units).
Takeaway #2: One Third of Properties Have 95% or Higher Occupancy
- There is a wide range of property level performance within the largest metropolitan markets. The average occupancy rate alone is not a tell-all indicator of a metro market.
- The median occupancy rate—which is defined as the mid-point of the distribution, with an equal number of properties below that rate as above that rate—is pulled higher compared with the average occupancy rate because more than one-third of the properties within the 31 NIC MAP Primary markets have a 95% occupancy rate or higher. Moreover, more than half of all properties have rates higher than 90%.
- The flip side is that the average occupancy rate is being pulled down by the 31% of properties with occupancy rates below 85%, with a full 22% of properties having occupancy rates less than 80%. Those 22% of properties with less than 80% occupancy are likely to have financial challenges in a COVID-19 environment.

Takeaway #3: Seniors Housing Occupancy Year-over-Year: 15 Markets Up, 15 Markets Down
- This slide shows a comparison of occupancy rates among the NIC MAP Primary 31 seniors housing markets.
- For perspective, the 31 Market average was 87.7%, as seen in the middle of the slide by the green bar. Fifteen markets had occupancy rates higher than the Primary Market average. Starting on the left is the market with the highest first-quarter occupancy rate: San Jose, at 95.0%, followed by San Francisco at 91.5%. Then there are five markets with occupancy rates at 90%: Minneapolis, Baltimore, Boston, Los Angeles, and Portland OR.
- At the other end of the spectrum is Houston, with an occupancy of 82.1%, followed by Atlanta (82.7%), Las Vegas (83.0%), San Antonio (83.5%) and Phoenix (84.2%).
- In the first quarter, 15 markets had occupancy rates lower than year-earlier rates, while 15 had occupancy rates higher, and one was unchanged. The market with the most improvement was Cleveland where occupancy rose 3.5 percentage points to 84.9% from 81.4% one year ago, while the market with the greatest deterioration was Pittsburgh where occupancy fell more than three percentage points from 89.9% to 86.6%.

Takeaway #4: Annual 2019 Inventory Growth Slowed for Assisted Living
- Since the onset of the pandemic, NIC has been conducting a weekly Executive Survey Insights, a new survey designed to collect timely insights into the impact of COVID-19 on operators in the seniors housing and skilled nursing sector.
- The chart below presents findings from responses collected at the beginning of the pandemic in mid-March to the week ending April 12th. The data represents responses from 180 and 146 owners and C-suite executives across the nation who answered the questionnaire in Wave 1 and Wave 2, respectively.
- Approximately one-third to one half of organizations reporting on their independent living, assisted living and memory care units in Wave 2—across their respective portfolios of properties—saw a decrease in occupancy from the prior month. Roughly one fourth saw a decrease compared with the prior week. There were more survey respondents reporting a decrease in occupancy in Wave 2 results than in Wave 1 results.
- Conversely, roughly half to two-thirds of organizations reporting on their independent living, assisted living and memory care units in Wave 2 saw no change or an increase in occupancy rates from the time they responded April 1-April 12, 2020 to one month prior; down from roughly two-thirds to three-quarters in Wave 1.
- Organizations with nursing care beds reported the largest directional declines in occupancy among the four segment types and more respondents reported declines in Wave 2 than in Wave 1. Nearly three-quarters to half of organizations with nursing care beds and assisted living units reported occupancy declines in Wave 2. This may be driven by fewer hospitals discharging patients to post-acute care settings for rehabilitative therapy as hospitals defer elective surgeries due to the pandemic.

If your organization would like to participate in the weekly Executive Survey, please click here to access the survey tool.
Key Takeaway #5: Seniors Housing Pricing Off Recent High
- This slide presents the rolling four-quarter price per unit for seniors housing and price per bed for nursing care.
- The price per unit and price per bed came off their recent highs as both seniors housing and nursing care decreased from the fourth quarter 2019.
- Seniors housing decreased 2% quarter-over-quarter to end the first quarter at $193,200 price per -unit, but that was an increase of 14% from the prior year.
- Nursing care decreased slightly to end the quarter at $78,700 price per bed, however that was also an increase from the prior year, increasing 20% year-over-year.

About Beth Mace
Beth Burnham Mace is a special advisor to the National Investment Center for Seniors Housing & Care (NIC) focused exclusively on monitoring and reporting changes in capital markets impacting senior housing and care investments and operations. Mace served as Chief Economist and Director of Research and Analytics during her nine-year tenure on NIC’s leadership team. Before joining the NIC staff in 2014, Mace served on the NIC Board of Directors and chaired its Research Committee. She was also a director at AEW Capital Management and worked in the AEW Research Group for 17 years. Prior to joining AEW, Mace spent 10 years at Standard & Poor’s DRI/McGraw-Hill as director of its Regional Information Service. She also worked as a regional economist at Crocker Bank, and for the National Commission on Air Quality, the Brookings Institution, and Boston Edison. Mace is currently a member of the Institutional Real Estate Americas Editorial Advisory Board. In 2020, Mace was inducted into the McKnight’s Women of Distinction Hall of Honor. In 2014, she was appointed a fellow at the Homer Hoyt Institute and was awarded the title of a “Woman of Influence” in commercial real estate by Real Estate Forum Magazine and Globe Street. Mace earned an undergraduate degree from Mount Holyoke College and a master’s degree from the University of California. She also earned a Certified Business Economist™ designation from the National Association of Business Economists.
Connect with Beth Mace
Read More by Beth Mace