NIC MAP® Data Service clients attended a webinar in mid-January on the key seniors housing data trends during the fourth quarter of 2019. Key takeaways included the following:
Takeaway #1: Seniors Housing Occupancy Edged Higher in 4Q 2019
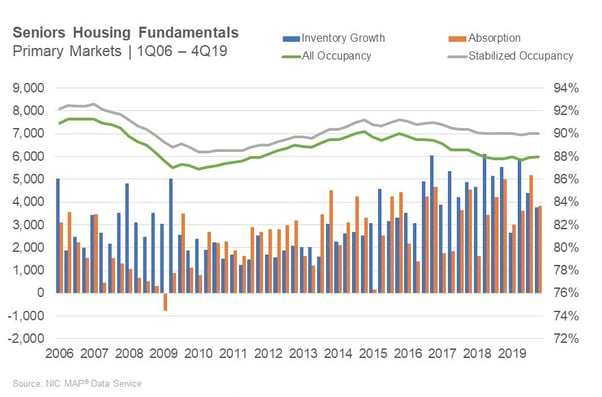
- The occupancy rate for seniors housing inched up 10 basis points (bps) to 88.0% in the fourth quarter. This was the same level as in the first quarter and placed it 30 bps above the eight-year low of 87.7% reached in the second quarter of 2019. As the chart shows, the all occupancy rate for seniors housing has been hovering near 88.0% since the second quarter of 2018.
- For seniors housing, net absorption totaled 3,835 units in the fourth quarter, slightly more than inventory growth of 3,758 units.
Takeaway #2: Annual 2019 Inventory Growth Slowed for Assisted Living
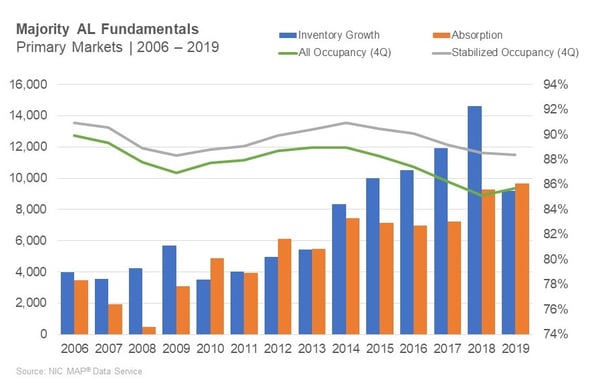
- In the fourth quarter, the assisted living occupancy rate rose 30 bps to 85.7%, the highest level since the fourth quarter of 2017 and up 60 bps from the year-earlier low of 85.1%. During the quarter, net absorption totaled 2,407 units, outpacing new inventory growth of 1,593 units.
- On an annual basis, assisted living net absorption reached a second record year in a row. It totaled 9,661 units during 2019, the most units absorbed during a year since NIC began reporting the data in 2006 and slightly more than in 2018 (9,264). Net demand exceeded inventory growth of 9,175 units, albeit slightly (486 units), for the first time since 2012.
- Note the slowdown in inventory growth in 2019 compared with 2018. In 2018, there were 14,635 units of assisted living inventory added in the NIC Primary 31 markets. This compares with 9,175 in 2019 or roughly two thirds the volume of 2018.
- Based on this inventory data, it appears that 2018 was the peak year for inventory growth and 2019 may be the inflection year.
Takeaway #3: Independent Living Units Under Construction Steady
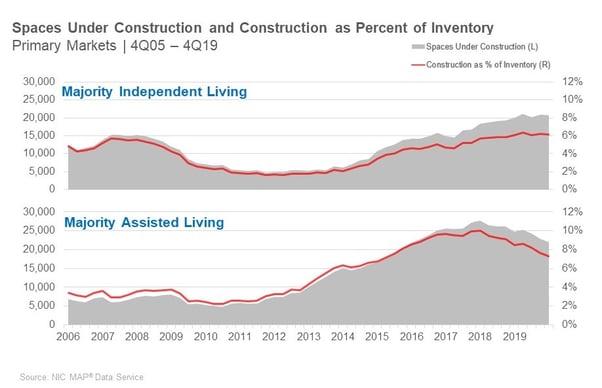
- Construction as a share of inventory for majority assisted living properties decelerated and equaled 7.3% or 22,000 units in the fourth quarter. This includes all properties under construction from start to completion. This was the lowest rate since 2015 and down from a peak of 10% in late 2017.
- The same pattern is not yet evident in independent living as the graph shows. In the fourth quarter, construction as a share of inventory totaled 6.2%, where it has been hovering for the past year.
- Note, however, in terms of units under construction for IL, it was almost the same as for assisted living at 21,000 units in the fourth quarter.
Takeaway #4: Seniors Housing Occupancy Year-over-Year: 17 Markets Up, 13 Markets Down
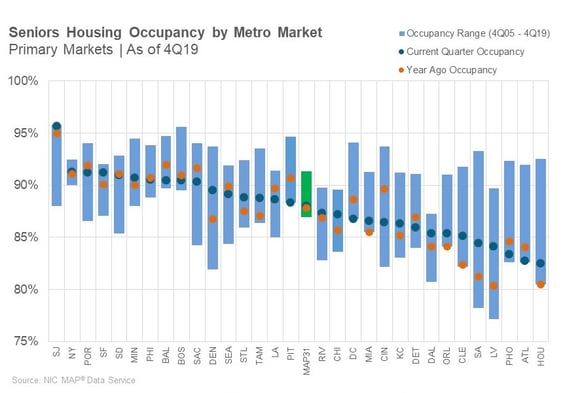
- The graph below shows a comparison of occupancy rates among the NIC MAP Primary 31 seniors housing markets.
- For perspective, the 31 Market average was 88.0%, as seen in the middle of the graph by the green bar. Sixteen markets had occupancy rates higher than the Primary Market average. Starting on the left is the market with the highest first-quarter occupancy rate: San Jose, at 95.7%, a new high for that market. After San Jose, the highest occupancy levels are in New York, Portland, San Francisco and San Diego.
- At the other end of the spectrum are Houston, with an occupancy of 82.5% followed by Atlanta (82.7%), Phoenix (83.4%) and Las Vegas (84.1%).
- This chart highlights the very wide disparity between the best performing markets and the poorest performing markets with a 13.0 percentage difference between the strongest and the poorest performing markets.
- In the second quarter, 13 markets had occupancy rates lower than year-earlier rates, while 17 had occupancy rates higher and one was unchanged.
Key Takeaway #5: Private Buyers Still Very Active in 4Q 2019
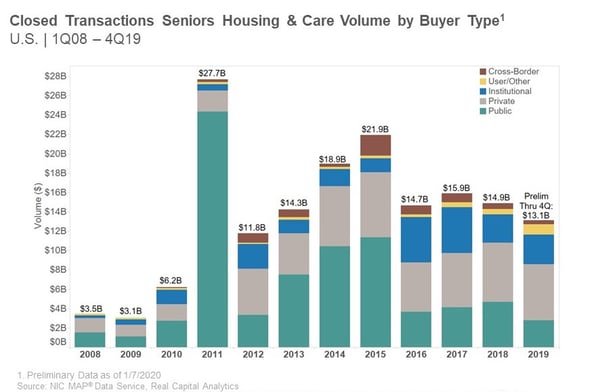
- Seniors housing and care closed transactions volume in 2019 totaled $13.1 billion, with the fourth quarter representing 14% of that volume, according to the preliminary figures for 2019. Volume has varied by buyer type.
- The private buyer type has been consistent in terms of closed transactions volume over the past 3 years, ranging from $5.6 billion in 2017 to $6.1 billion closed in 2018 to $5.8 billion in 2019, according to preliminary data.
- The institutional buyer type represented 23% of the $13.1 billion in closed transactions in 2019 as its total closed dollar volume increased by 5% from 2018 when it represented 20% of volume and closed $2.9 billion in transactions. The current closed total volume for 2019 is $3.1 billion.
- Public buyers representation of total volume decreased from 32% in 2018 to 21% in 2019. In terms of the dollar volume, it saw a significant decline in closed transaction volume which dropped 41% from 2018’s $4.7 billion to close 2019 at $2.8 billion.

###
About Beth Mace
Beth Burnham Mace is a special advisor to the National Investment Center for Seniors Housing & Care (NIC) focused exclusively on monitoring and reporting changes in capital markets impacting senior housing and care investments and operations. Mace served as Chief Economist and Director of Research and Analytics during her nine-year tenure on NIC’s leadership team. Before joining the NIC staff in 2014, Mace served on the NIC Board of Directors and chaired its Research Committee. She was also a director at AEW Capital Management and worked in the AEW Research Group for 17 years. Prior to joining AEW, Mace spent 10 years at Standard & Poor’s DRI/McGraw-Hill as director of its Regional Information Service. She also worked as a regional economist at Crocker Bank, and for the National Commission on Air Quality, the Brookings Institution, and Boston Edison. Mace is currently a member of the Institutional Real Estate Americas Editorial Advisory Board. In 2020, Mace was inducted into the McKnight’s Women of Distinction Hall of Honor. In 2014, she was appointed a fellow at the Homer Hoyt Institute and was awarded the title of a “Woman of Influence” in commercial real estate by Real Estate Forum Magazine and Globe Street. Mace earned an undergraduate degree from Mount Holyoke College and a master’s degree from the University of California. She also earned a Certified Business Economist™ designation from the National Association of Business Economists.
Connect with Beth Mace
Read More by Beth Mace