NIC MAP® Data Service clients attended a webinar in mid-July on the key seniors housing data trends during the second quarter of 2019. Key takeaways included the following:
Takeaway #1: Seniors Housing Occupancy Fell to its Lowest Rate Since 2011
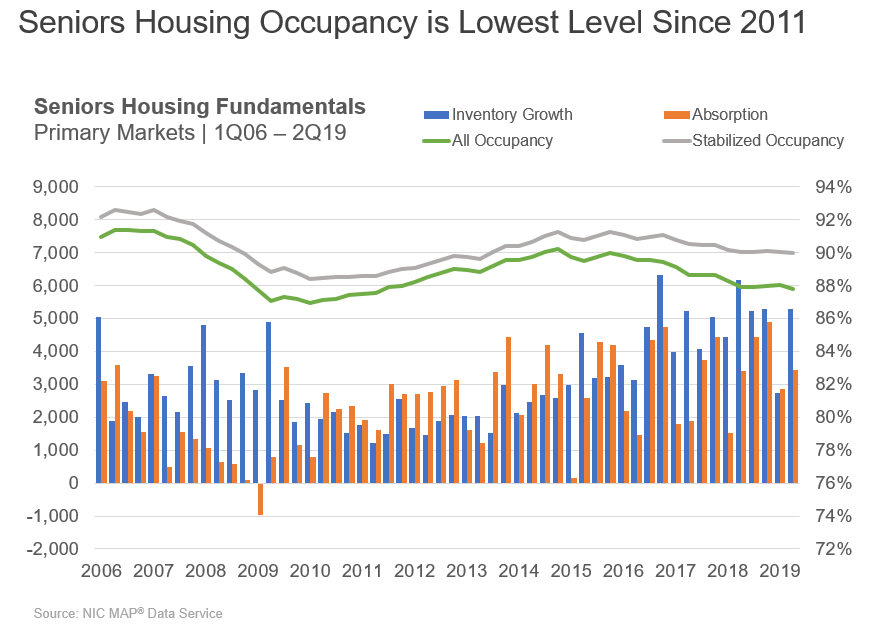
- Based on the quarterly patterns of inventory and absorption, the all occupancy rate for seniors housing, which includes properties still in lease up, fell 20 basis points to 87.8% in the second quarter, its lowest level since 2011 and 2.4 percentage points below its most recent high of 90.2% in the fourth quarter of 2014.
- Stabilized occupancy for all seniors living properties (defined by NIC as properties that have been open for at least two years or, if open for less than two years, have already reached a 95% occupancy level) was more than two full percentage points higher than total occupancy and stood at 89.9% in the second quarter, down 10 basis points from the first quarter, and down 10 basis points from year-earlier levels. The 210-basis point difference between the total and the stabilized occupancy rates reflect the large number of properties recently opened and still in lease up.
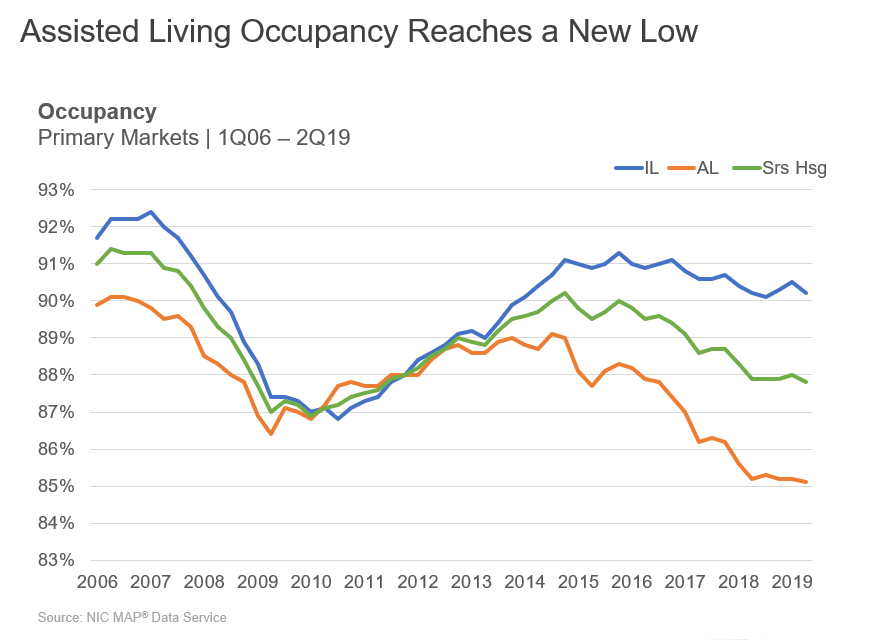
Takeaway #2: Assisted Living Occupancy Slipped to 85.1%, Its Lowest Level Ever Recorded by NIC.
- As of the second quarter, there was a five-percentage point difference in occupancy rates, with assisted living hitting a record low of 85.1%, while independent living remained above 90% at 90.2%, unchanged from one year ago, but down 30 basis points from the first quarter.
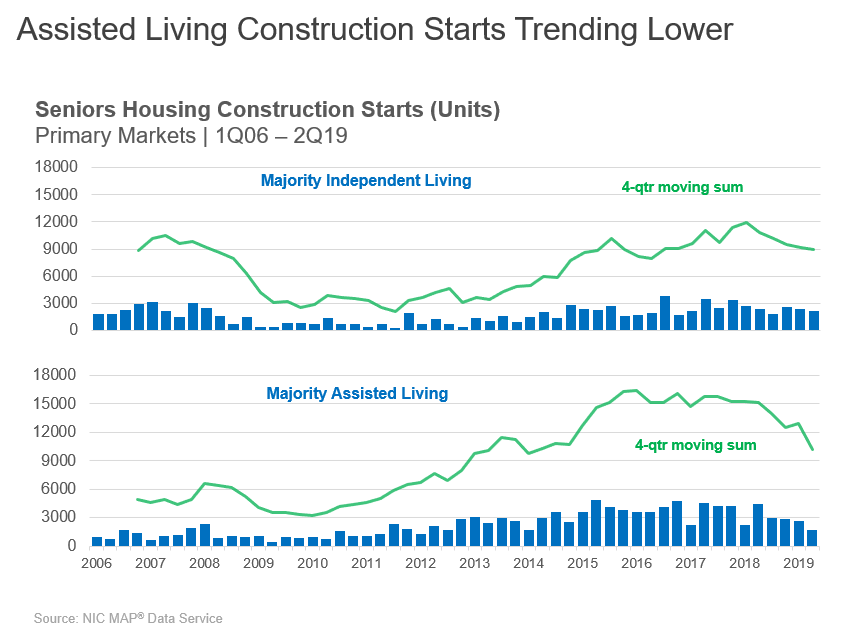
Takeaway #3 Assisted Living Construction Starts Trending Lower
- The four-quarter moving sum of starts for majority assisted living continued to slow in the second quarter of 2019--AL starts totaled roughly 1,700 units, the fewest starts since the first quarter of 2014. On a four-quarter aggregate basis, starts totaled 10,175 units, also the fewest since 2014. As a share of inventory, this amounted to 3.5%. For perspective, in late 2015, it was 6.5%.
- While this may look encouraging to those concerned about the construction cycle we are currently in, it is important to note that due to the nature of this data, it is often revised either up or down.
- For independent living, there is also a downward trend. Starts on a rolling four-quarter basis, totaled 8,939 units in the first quarter. As a share of inventory, this equaled 2.7%.
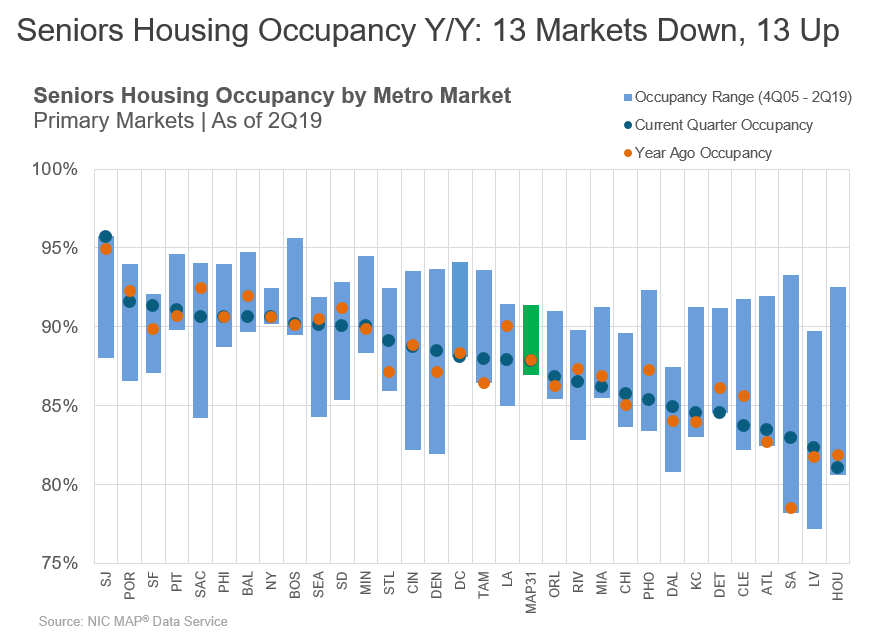
Key Takeaway #4: Several Markets Experienced Higher Occupancy Rates
- In the second quarter, 13 markets had occupancy rates lower than year-earlier rates, while 13 had occupancy rate higher and five were unchanged. For perspective, in the first quarter, seventeen of the thirty-one markets had occupancy rates lower than year-earlier levels, while thirteen markets had higher occupancy rates than one year ago and one was unchanged.
- The best improvement from year-earlier levels continued to occur in San Antonio where the occupancy rate was up nearly 4.4 percentage points from year-earlier levels to 82.9%. While this still places San Antonio as having the third lowest occupancy rate, it is a sign in the right direction. In fact, construction as a share of inventory had reached a very high level of 21.6% in Q1 2015, so the fact that there is very little development currently underway (3.1% of its inventory or 302 units) is a good sign that further occupancy improvement will be able to occur in the coming months.
- Eighteen markets had occupancy rates higher than the Primary Market average. Starting on the left in the chart is the market with the highest first-quarter occupancy rate: San Jose, at 95.7%, a new high for that market and up 80 basis points from a year ago.
- At the other end of the spectrum are Houston, with an occupancy of 81.1% followed by Las Vegas (82.3%).
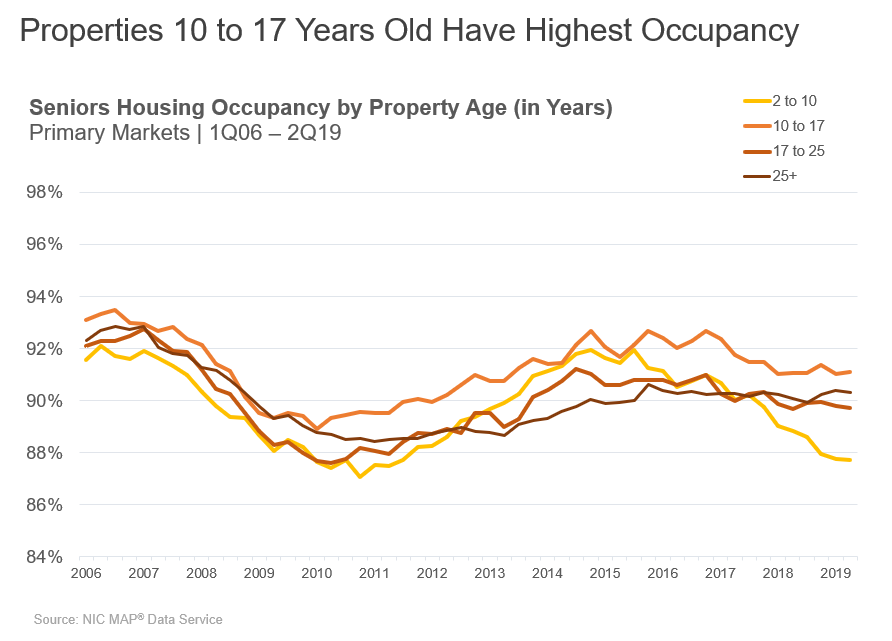
Takeaway #5: Properties 10 to 17 Years Old Have Highest Occupancy
- Occupancy rates vary by age. The group of properties that are between 10 and 17 years old have the highest occupancy rates. Over the entire time frame, the average occupancy was 91.2%.
- Since mid-2017, properties aged 2 to 10 years have had the lowest occupancy rates. Between 2012 and 2017, they placed second after those aged 10 –17 years of age.
- Since 2017, properties 25 years and older have done better in terms of higher occupancy rates than those aged 2 to 10 years. In the second quarter they averaged 90.2%, better than the younger aged properties.
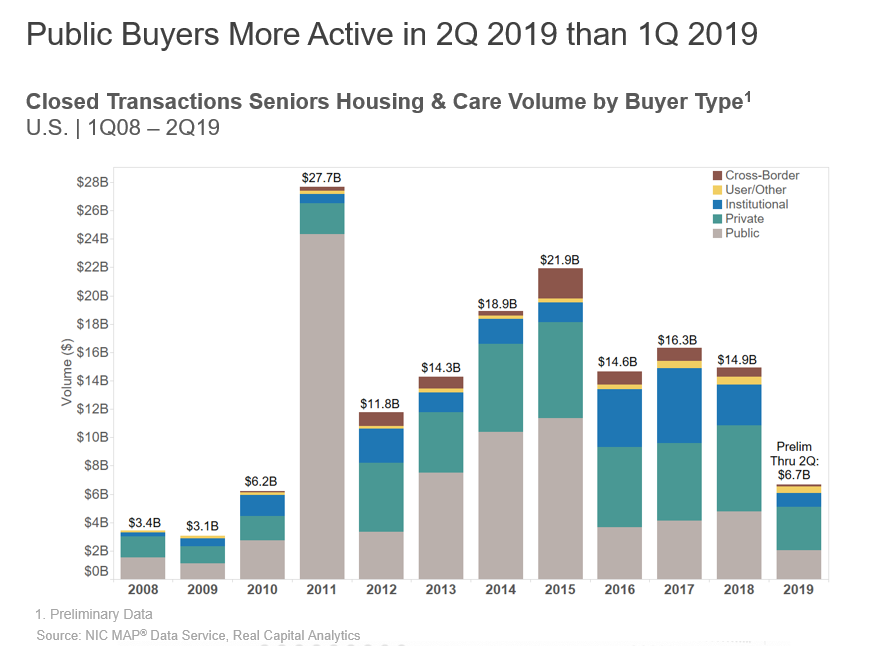
Key Takeaway #6: Seniors Housing and Nursing Care Transaction Dollar Volume Up 41% from Year-Earlier Levels
- Preliminary data shows that seniors housing and care transactions volume registered $3.4 billion in the second quarter of 2019. This includes $2.2 billion in seniors housing and $1.2 billion in nursing care transactions. The total volume was the same as the previous quarter and up 41% from year-earlier levels.
- The rolling four-quarter total seniors housing and care volume was up 6.7% from the prior quarter to $15.6 billion.
- There was a total of 121 deals closed in the second quarter.
- Portfolio deals decreased 16% from 32 closing in the first quarter of 2019 to 27 in the second quarter.
About NIC
The National Investment Center for Seniors Housing & Care (NIC) is a nonprofit 501(c)(3) organization whose mission is to support access and choice for America’s seniors by providing data, analytics, and connections that bring together investors and providers.
Connect with NIC
Read More by NIC