
Insights in Seniors Housing & Care
Introduction. An inquiry the NIC Analytics team frequently receives is “How much senior housing inventory exists in the United States?” To answer this question, the NIC Analytics team has historically generated estimates of the United States’ national supply of senior housing and nursing care and published those estimates in the biennial editions of the NIC Investment Guide. Now, however, industry stakeholders no longer need to wait for new releases of the NIC Investment Guide for national supply estimates because NIC MAP Vision, an affiliate of NIC, offers subscribers quarterly supply estimates for the entire U.S. (with more detailed data dependent upon subscription level).
This blog explores national supply estimates published by NIC in 2020 and discusses how much senior housing and nursing care exists in the United States using data from NIC MAP Vision as of first quarter 2022.
NIC MAP Vision tracks inventory for the entire nation. NIC MAP Vision provides detailed documentation regarding how its supply estimates are calculated and tracked, including the methodology that was used to generate the supply estimates in all 50 states beyond the areas that are traditionally tracked by NIC MAP®. NIC MAP Vision’s supply estimates beyond the NIC MAP 140 Markets are derived from Melissa Data. Melissa Data aggregates information from county planning departments across the United States, which NIC MAP Vision uses to derive supply estimates for independent living (IL), assisted living (AL), and memory care (MC).
As explained in the VisionLTC portal, because the 50 states and Washington D.C. all have different laws and regulations, there are different methods and standards for tracking and reporting data on senior housing properties. Nursing care properties, however, are federally regulated and therefore have more consistency in their data across the U.S.
NIC MAP Vision subscribers that have a NIC MAP subscription will have the NIC MAP data as the pre-set default in the VisionLTC portal for the areas tracked by NIC MAP. Users can choose to input their own supply data to be included in the portal if, for instance, they are tracking additional units that would not qualify for tracking by NIC MAP, such as subsidized senior housing units.
All NIC MAP Vision supply data are updated on a quarterly basis (both inside and outside the 140 markets tracked by NIC MAP).One important note is that the VisionLTC supply data outside of the 140 NIC MAP metropolitan markets are estimated by bed count, whereas the supply data for the IL, AL, and MC segments in the NIC MAP 140 Markets are tracked by unit count. Units of IL, AL, and MC tracked by NIC MAP may have a single bed or have multiple beds and can be either private (such as a married couple in one unit) or semi-private (two unrelated people as roommates). Readers that are familiar with other real estate product types may be familiar with the term “doors,” which are comparable to units.
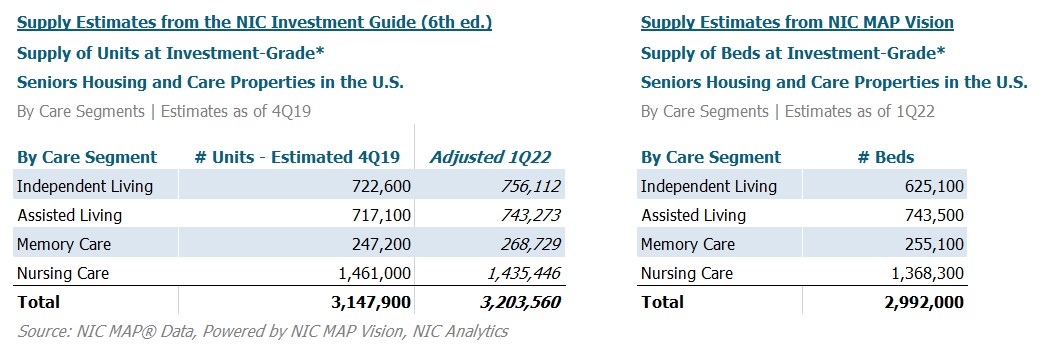
How NIC estimated supply in 2020. For publication of the Sixth Edition of the NIC Investment Guide, NIC generated national supply estimates using the fourth quarter 2019 vintage of NIC MAP data and data about households age 75+ from the U.S. Census Bureau. Next, we calculated what percent of households age 75+ were in the NIC MAP 99 Primary and Secondary Markets, which was 61.3%. To make the estimation easy to understand and easy to replicate, we assumed that the proportion of U.S. senior housing in the NIC MAP 99 Primary and Secondary Markets was the same as the share of U.S. households age 75+ in the NIC MAP 99 Primary and Secondary Markets. From this assumption, we scaled the base units (open inventory plus units under construction) and grew it to represent 100% of the nation rather than 61.3% of the nation. Finally, we rounded our projections to 100s of units, in line with our other publication methods.
Importantly, we also included units under construction (3.4% of the total base for the projection) to ensure that the estimates included units that had broken ground in order to not underestimate the national size of the market.
Investment grade properties are those with a minimum of 25 units/beds (except freestanding memory care) that charge market rates and/or accept Medicaid for the housing and services offered. NIC MAP also tracks freestanding memory care that has a minimum of 16 units because the freestanding memory care model has special considerations for residents and can sometimes have smaller unit counts than other product types.
How did we do and how much supply is estimated now? With the exception of the independent living segment, the national estimates that NIC generated for the Sixth Edition of the NIC Investment Guide in 2020 were very similar to the national supply estimates from NIC MAP Vision.
Nursing care comprises just under half (45.7%) of all of senior housing and care inventory in the United States as of first quarter 2022 and has the largest total number of beds of any of the four segments at an estimated 1,368,300 beds. Nursing care is tracked and estimated by bed both inside and outside of the NIC MAP 140 Markets, so our estimate of nursing care in 2020 was a national estimate of beds. Applying the growth rate from 4Q19 to 1Q22 (-1.7%) to the estimate of nursing care from 2020 (1,461,000 beds), the adjusted estimation would be equivalent to an estimate of 1,435,446 beds in first quarter 2022. By comparison, NIC MAP Vision estimates that there are 1,368,300 nursing care beds in the US in 1Q22. This difference of 67,146 beds is less than 5% of the estimated supply of nursing care beds in the U.S. from NIC MAP Vision.
The number of total operational nursing care beds has been declining over the years, so the decrease in stock is unsurprising. Recent analysis from NIC Analytics has discussed some of these declines in stock.
The second largest of the four care segments (IL, AL, MC, NC) is assisted living, which accounts for 24.8% of all senior housing and care stock. We estimated that there were 717,100 units of assisted living in the U.S. in 2020. Increasing this estimate by 3.6% (the inventory growth for AL units in the NIC MAP 140 Markets), this estimate would have grown to be 743,272 units in first quarter 2022 compared to NIC MAP Vision’s estimate of 743,500 beds. This is a difference of a mere 227, an astonishingly small number. However, there is still the issue of the difference between beds and units for the area outside of the NIC MAP 140 markets (which is discussed in further detail below).
Memory care is a newer concept in comparison to independent living and assisted living and is the youngest of the care segments as a product type. It is also more specialized and is a highly needs-driven product. As a result of these factors, there is less memory care supply than there is assisted living and memory care comprises a mere 8.5% of total senior housing and care supply in the United States as of first quarter 2022. In 2020 we estimated that there were 247,200 units of memory care. Growing this estimate by 8.7% (the inventory growth rate for MC units in the 140 Markets from 4Q19 to 1Q22), this is equivalent to 268,729 units in first quarter 2022. The NIC MAP Vision estimate of memory care in the U.S. is lower than that estimate at 255,100 beds, a difference of 13,600. This is equivalent to 5.3% of the NIC MAP Vision estimate of MC beds if we treat each unit as one bed, but this percent is higher if we make a different assumption about the relationship between beds and units.
Independent living is a larger share of the total inventory than memory care but smaller than assisted living. Independent living comprises 20.9% of the total senior housing and care inventory in the United States as of first quarter 2022. Unfortunately, our independent living estimate was not as close as our other estimates. We estimated that there were 722,600 units of independent living in 2020. After applying the growth rate for IL units from 4Q19 to 1Q22 (5.0%), these estimated 722,600 units would have grown to be 756,112 units in first quarter 2022. NIC MAP Vision estimates that there are 625,100 IL beds in the United States in first quarter 2022 (a difference of over 141,000 or 22.6% of the estimated IL beds from NIC MAP Vision if each of the projected IL units in 2020 was assumed to equal one IL bed).
With the exception of the independent living segment, the NIC estimates were close to the estimated totals of beds calculated by NIC MAP Vision.
Note that to grow the segment inventory estimates from the Sixth Edition of the NIC Investment Guide with data from fourth quarter 2019 to size estimates for the first quarter of 2022, we applied the inventory growth rate from the NIC MAP 140 Markets per segment (5.0% for IL, 3.6% for AL, 8.7% for MC, and -1.7% for NC) to the estimates from 4Q19 to grow those estimates by the same inventory growth that occurred since 4Q19 to adjust for the inventory growth over the time period. However, this is a rough approach. This assumes that the proportion of US households aged 75+ in the NIC MAP 99 Markets has remained the same since the data that was available at time of estimation for the Sixth Edition of the NIC Investment Guide, which is not the case (that proportion has increased).
Possible factors contributing to the independent living difference. The difference in the independent living estimates could be driven by a couple of factors. First, it could be that since independent living is a more lifestyle-based product than assisted living or memory care, there is less of a case to build independent living in less populated areas outside of the 140 Markets tracked by NIC MAP than there is for assisted living or memory care. There could also be some unseen factor related to inconsistencies in state regulations of tracking independent living compared to tracking of AL or MC. While nursing care has the highest level of uniformity for reporting as discussed earlier, independent living has the least requirements for reporting to both states and federal sources. Maybe lowered requirements for reporting could also result in a higher likelihood of not being captured by the methods of tracking that Melissa Data uses.
Beds versus units. Another aspect that makes this comparison less precise for the IL, AL, and MC segments is the difference between beds and units mentioned above. NIC MAP tracks nursing care by bed so looking at that comparison between estimates is easier (after factoring in inventory growth since fourth quarter 2019, our estimates varied from NIC MAP data by less than 5 percent). However, the NIC MAP 140 Markets track IL, AL, and MC by units whereas the areas outside of the 140 Markets have estimated beds as inventory. As a result, the national supply estimates from the first quarter 2022 NIC MAP Vision data are a blend of units for the 140 Markets and beds for the other areas. Splitting this inventory by the 140 NIC MAP markets vs the area outside of NIC MAP coverage, 29.2% of the senior housing (IL, AL, MC) inventory tracked by NIC MAP Vision is outside of the 140 Markets and is estimated by bed.
Conclusions. NIC MAP Vision offers subscribers estimates of the supply of senior housing and care that are updated on a quarterly basis and provides timely insight as to how much supply exists both in local geographies and on a broader scale. As of first quarter 2022 nearly three million beds of senior housing and care inventory were tracked by NIC MAP Vision in the United States. Going forward, inventory will continue to expand, although at a reduced pace in the near term because of the effects of the pandemic on supply pipelines. During the first several months of the pandemic, banks slowed their lending activity due to great uncertainty which in turn reduced the number of projects that broke ground and units started. This has had the effect of slowing inventory growth today, two years later. Further, supply constraints, rising materials prices, higher interest rates and shortages of workers in the building industry has limited recent development as many projects increasingly do not pencil out for reasonable returns.
Note that the data presented are believed to be accurate, but not guaranteed, and are subject to future revision. To learn more about NIC MAP® data, powered by NIC MAP Vision, and about accessing the data featured in this article, schedule a meeting with a product expert today.
Anne Standish is former Research Statistician in the Outreach Group at the National Investment Center for Seniors Housing & Care (NIC). At NIC, Anne is an important contributor to NIC’s analytics and has been involved in a number of initiatives focused on the analysis of NIC’s seniors housing time series data. While working at NIC, she received her M.S. in Applied Statistics from Villanova University. She also has a B.S. in Psychological & Social Sciences from Penn State Abington. Prior to NIC, she worked in a range of academic research positions. Outside of having a passion for quantitative research methods and statistical analysis, Anne also has an interest in data visualization. Beth Burnham Mace is Special Adviser and former Chief Economist and Director of Capital Markets Research at the National Investment Center for the Seniors Housing & Care Industry (NIC). Prior to joining the staff at NIC, she served as a member of the NIC Board of Directors for 7 years and chaired NIC’s Research Committee. Ms. Mace was also a Director at AEW Capital Management and worked in the AEW Research Group for 17 years. While at AEW, Ms. Mace provided primary research support to the organization’s core and value-added investment strategies and provided research-related underwriting in acquisition activity and asset and portfolio management decisions. Prior to joining AEW in 1997, Ms. Mace spent ten years at Standard & Poor’s DRI/McGraw-Hill as the Director of the Regional Information Service with responsibility for developing forecasts of economic, demographic, and industry indicators for 314 major metropolitan areas in the U.S. Prior to working at DRI, she spent three years as a Regional Economist at the Crocker Bank in San Francisco. Ms. Mace has also worked at the National Commission on Air Quality, the Brookings Institution and Boston Edison. Ms. Mace is a member of the National Association of Business Economists (NABE), ULI’s Senior Housing Council, the Urban Land Institute and New England Women in Real Estate (NEWIRE/CREW). In 2014, she was appointed a fellow at the Homer Hoyt Institute and was awarded the title of a “Woman of Influence” in commercial real estate by Real Estate Forum Magazine and Globe Street. Ms. Mace is a graduate of Mount Holyoke College (B.A.) and the University of California (M.S.). She has also earned The Certified Business Economist™ (CBE), which is the certification in business economics and data analytics developed by NABE. The CBE documents a professional’s accomplishment, experience, abilities, and demonstrates mastery of the body of knowledge critical in the field of economics and data analytics.
Connect with Anne Standish and Beth Mace