Insights in Seniors Housing & Care
By: Omar Zahraoui | March 09, 2023
Business Environment | Market Trends | NIC MAP Data | NIC MAP Vision | Senior Housing | occupancy
The senior housing stabilized occupancy rate for the NIC MAP Primary Markets edged up to 84.3% in the February 2023 reporting period, up 0.2 percentage point (pps) from the January 2023 reporting period on three-month rolling basis, according to intra-quarterly NIC MAP® data, released by NIC MAP Vision. From its pandemic record low of 80.3% in June 2021, senior housing stabilized occupancy increased by 4.0pps but remained 5.1pps below pre-pandemic March 2020 levels of 89.4%. Drilling down by metropolitan markets, Boston ranked first among the 31 NIC MAP Primary Markets with a stabilized occupancy rate of 89.8% (up 0.2pps from January 2023 and 7.1pps from its pandemic record low, but still 2.3pps below March 2020 levels). Boston’s stabilized occupancy rate was nearly 6pps above the average for NIC MAP Primary Markets.
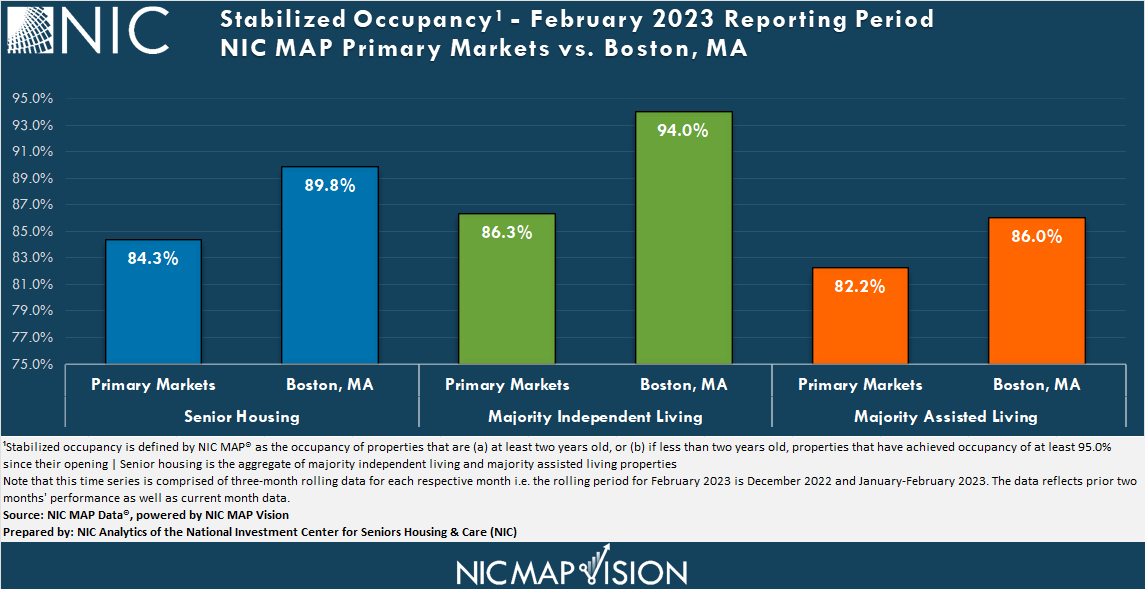
By Majority Property Type. At 86.3%, the stabilized occupancy rate for majority independent living (IL) properties for the NIC MAP Primary Markets inched up 0.1pps from the January 2023 reporting period on a three-month rolling basis, but remained 5.0pps below March 2020 levels. For majority assisted living properties (AL), the stabilized occupancy rate for the NIC MAP Primary Markets was up 0.2pps to 82.2% from January 2023 but still 5.0pps below March 2020 levels.
Stabilized occupancy for AL continued to recover relatively fast compared with IL despite the relatively large inventory growth since the onset of the pandemic, but it's notable that the AL stabilized occupancy rate also fell further from peak to trough. From it’s pandemic-related low, stabilized occupancy for AL increased by 5.5pps, twice the increase for IL (up 2.7pps since June 2021).
Inventory Growth. From March 2020 to February 2023, the inventory of IL and AL for the NIC MAP Primary Markets increased by 5.6% and 7.4%, respectively. However, from year-earlier levels, the inventory of IL increased by 1.9% or 6,490 units in the February 2023 reporting period, 0.3pps larger than that of AL (1.6pps). Notably, for both IL and AL inventory growth continued to be relatively slow compared with pre-pandemic levels, but growth in inventory did occur.
While new inventory compounded the downward pressure on occupancy during the height of the pandemic, this slowdown in the growth in senior housing inventory and development activity is helping to bring supply and demand into better balance and will ultimately serve as a tailwind for the occupancy recovery.
Select Metropolitan Markets. Stabilized occupancy rates increased or remained stable in 20 of the 31 Primary Markets for IL in the February 2023 reporting period compared with January 2023. Boston's stabilized occupancy inched down by 0.1pps from the January 2023 reporting period, but at 94.0%, Boston continued to rank the highest among the 31 NIC MAP Primary Markets. Boston recovered 5.2pps from its pandemic-low and is currently 1.5pps short of reaching a full recovery and returning to March 2020 levels (in terms of stabilized occupancy). Orlando IL stabilized occupancy improved by 0.2pps from January 2023, but at 79.2%, it is still ranked at the bottom of the pack. In fact, Orlando is the only IL primary market with an average occupancy rate below 80%.
Stabilized occupancy rates rose or remained stable in 24 of the 31 Primary Markets for AL in February 2023 compared with January 2023. Boston had the second highest occupancy rate for AL among the 31 Primary Markets at 86.0% (up 0.4pps from January 2023 and 8.8pps from its pandemic record low, but still 3.1pps below March 2020 levels). Cleveland stabilized occupancy rate stood at 78.2% in February 2023, up 0.3pps from January 2023. Cleveland had the second lowest occupancy rate for AL among the 31 Primary Markets.
Keep track of the most timely comprehensive review of the sector’s market fundamentals and trends. The NIC Intra-Quarterly Snapshot monthly publication, available for complimentary download on our website, continues to provide a powerful and closely watched means to stay ahead of industry trends, even as senior housing markets sustain a fast pace of evolution and adaptation, amidst an apparent recovery.
The March 2023 IQ Snapshot report will be released on our website on Thursday, March 9, 2023, at 4:30pm.
Interested in learning more about NIC MAP Intra-Quarterly data? To learn more about NIC MAP Vision data, schedule a meeting with a product expert today.
Omar Zahraoui, Principal at the National Investment Center for Seniors Housing & Care (NIC), is a seniors housing research professional with expertise in providing quantitative analysis and insights on seniors housing & care market data; building new products and reporting capabilities, including dashboards and proformas for clients and internal stakeholders; and implementing new processes and data solutions. Prior to his current role, Zahraoui worked as a data analyst, at Calpine Corporation, supporting the development of new-business strategy initiatives, analyzing sales and financial data, and developing statistical modeling of consumers’ behaviors to drive business performance. Zahraoui holds a Bachelor’s degree in Business Administration with concentrations in Finance and Management, a Master in Corporate Finance from IAE Lyon School of Management at Jean Moulin Lyon III University in France, and a Master of Science in Management Information Systems and Data Analytics from Pace University.
Connect with Omar Zahraoui