Insights in Seniors Housing & Care
Key Takeaway: In absence of local data, feasibility analysts use the so called “70/30” rule, where 70% of a PMA’s potential residents come from within the PMA and the remaining 30% come from outside the PMA. Analysis using VisionLTC data, powered by NIC MAP Vision, shows the story is not that simple.
Why Is It Important? As an experienced market and feasibility analyst who has studied hundreds of unique neighborhoods across the country prior to joining NIC as a Senior Principal more than four years ago, I am excited about the prospects of using VisionLTC data in gaining a more thorough understanding of local market dynamics than one can obtain without getting on an airplane, travelling to an unfamiliar city, and persuading seniors housing and care properties to share proprietary information. This blog post explores one area that has often kept me up at night as I consider how to best estimate demand for an existing or proposed property. In coming blog posts, I’ll explore other topics of interest as well.
Is your investment strategy to split sales with competitors or take market share? Has a development site been identified or is a proposed site being considered? Does a project’s marketing strategy need to be fine-tuned to meet pro forma projections? Or are you hunting for new sales opportunities for an expansion? Regardless of the rationale, the origins and characteristics of where recent seniors housing residents lived are among the most meaningful indicators of future purchase behavior.
Depending upon an area’s target market population density and considering the type of property under study (whether it serves an independent living, assisted living, memory care or nursing care resident), many seniors housing market analysts use generalized assumptions or “rules of thumb” in determining demand.
Referred to as the “70/30” rule, it is broadly estimated that 70% of a property’s residents will come from within a defined primary market area (PMA). But a PMA can be defined in many ways. Some of the more common methods used by market analysts include drawing a 3-mile, 5-mile or 10-mile radius around an existing property or a potential development site (depending on the care segment level served), using drive-time mapping technology to define the limits of how far prospective residents and/or their adult children will travel to the property from where they live or work based on unique traffic patterns and geographic and psychological barriers, and constructing polygons of Zip Codes, U.S. Census Tracts, or Block Groups.
For this analysis, which seeks to determine if data confirms the 70/30 rule, a 10-mile radius is assumed to be the PMA from which a community would attract the majority of its residents. Resident Origin, a product offering of VisionLTC, powered by NIC MAP Vision, is the first data set of its kind in the senior housing industry that provides clients with insight into the resident relocation patterns of 15,000+ seniors housing communities nationwide, illustrating the effective resident draw radius over the past 12- to 18-month time frame.
The following maps and charts describe the migration patterns of residents of nearby assisted living properties (within 1 to 2.5 miles from each other) in three different geographies: a leafy suburb of a major U.S. city—a mountain retreat vacation destination, and—a typical rural U.S. community. The green, yellow and red colorings on the maps represent the concentrations of where the subject property’s residents lived before moving into the property.
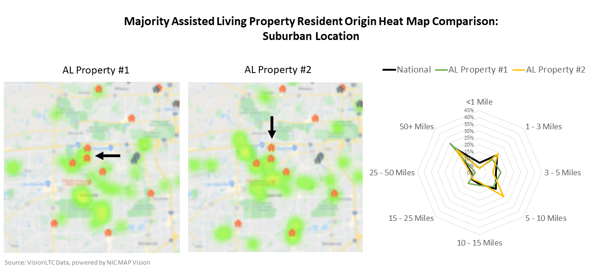
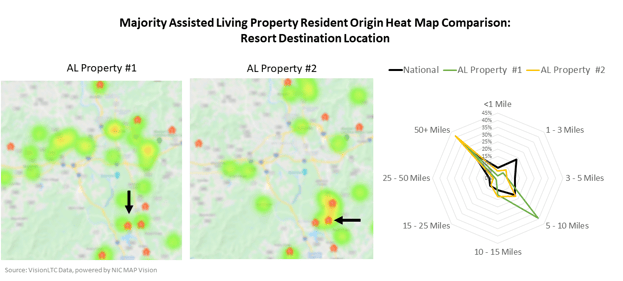

These maps and charts clearly illustrate the need for an analyst to understand the share of residents relocating from outside of the market area and which neighborhoods residents are relocating from as mileage does vary depending on different conditions. Additionally, many other factors can be considered when determining possible drivers of differences in resident origins among competitors:
So how well does the 70/30 “rule of thumb” apply? On a national basis, the 70/30 rule is a close approximation when applying a 50-mile primary market area as “in-market” origin. According to VisionLTC data, 75.7% of seniors chose communities less than 50-miles from their homes (in-market) while the remaining 24.3% of seniors chose communities more than 50-miles from their homes (out-of-market). However, the distance a resident or family member is willing to move or travel or visit varies in urban, suburban, and rural markets and by the type of care being sought. The resulting PMA typically serves a much smaller area than 50-miles.
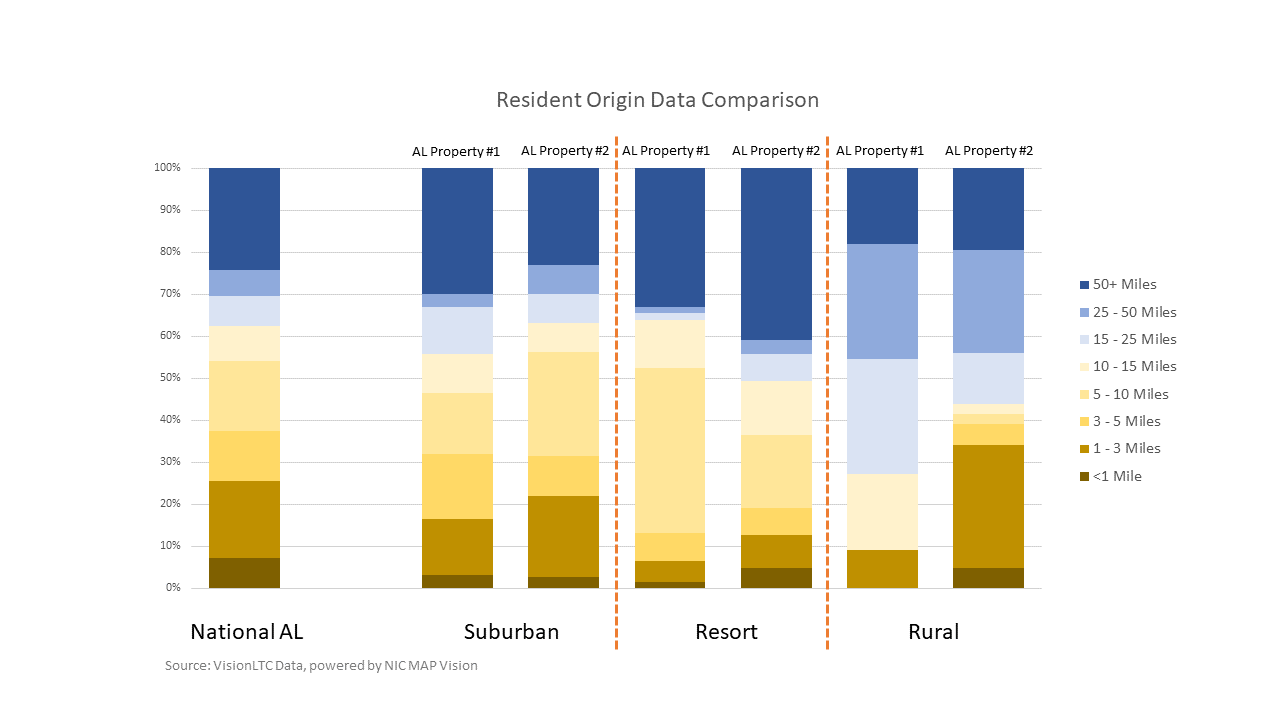
VisionLTC's Resident Origin data allows the analyst to develop more accurate market areas rather than guessing—and to quickly fine tune a primary market area based on actual relocation patterns and not just assumptions or “rules of thumb.”
About NIC MAP Vision:
NIC MAP Vision is a leading provider of comprehensive market data for the seniors housing and care sector. NIC MAP Vision brings together two strong, well-respected, and complementary teams and platforms – the market-leading NIC MAP® Data Service (NIC MAP) and VisionLTC’s best-in-class market research analysis platform. For more information, visit www.nicmapvision.com.
Lana Peck, former senior principal at the National Investment Center for Seniors Housing & Care (NIC), is a seniors housing market intelligence research professional with expertise in voice of customer analytics, product pricing and development, market segmentation, and market feasibility studies including demand analyses of greenfield developments, expansions, repositionings, and acquisition projects across the nation. Prior to joining NIC, Lana worked as director of research responsible for designing and executing seniors housing research for both for-profit and nonprofit communities, systems and national senior living trade organizations. Lana’s prior experience also includes more than a decade as senior market research analyst with one of the largest senior living owner-operators in the country. She holds a Master of Science, Business Management, a Master of Family and Consumer Sciences, Gerontology, and a professional certificate in Real Estate Finance and Development from Massachusetts Institute of Technology (MIT).
Connect with Lana Peck