NIC MAP Vision clients, with access to NIC MAP® data, attended a webinar in mid-October on key seniors housing data trends during the third quarter of 2022. Findings were presented by the NIC Analytics research team. Key takeaways included the following:
Takeaway #1: Seniors Housing Occupancy Rose a Full Percentage Point in 3Q 2022
- The occupancy rate for seniors housing—where seniors housing is defined as the combination of the majority independent living and assisted living property types—rose 1.0 full percentage point to 82.2% from the second quarter of 2022 to the third quarter of 2022 for the 31 NIC MAP Primary Markets. This marked the sixth consecutive quarter where occupancy did not decline. At 82.2%, occupancy was 4.3 percentage point above its pandemic-related low of 77.9% recorded in the second quarter of 2021 but was still 5.0 percentage points below its pre-pandemic level of 87.2% of the first quarter of 2020.
- Demand as measured by the change in occupied inventory or net absorption was very strong in the third quarter, increasing by 8,719 units in the Primary Markets. This was the strongest demand ever recorded by NIC MAP Vision except for the post-pandemic boost in demand seen in the third quarter of 2021 (11,922 units).
- Since the recovery began in second quarter 2021, 43,319 units of the 45,707 units placed back on the market have been re-occupied, or 95% of those units.
Takeaway #2: Occupied Units for Assisted Living Hit All-time High
- It's notable that the total number of occupied units reached a new high in the third quarter for Assisted Living, rising to 268,787 units. This was more than 1,600 units higher than the pre-pandemic first quarter 2020 level.
- This was not the case for Independent Living, where more than 4,000 units need to be occupied on a net basis to reach pre-pandemic occupied unit counts.
- This speaks to the value proposition of Assisted Living and its appeal to families that need the services and amenities offered to older adults. That said, the socialization aspect of Independent Living is attracting new residents after the long-extended pandemic related period of isolation for so many older adults.
Takeaway #3: Occupancy Recovery Well Underway, but More Room to Go
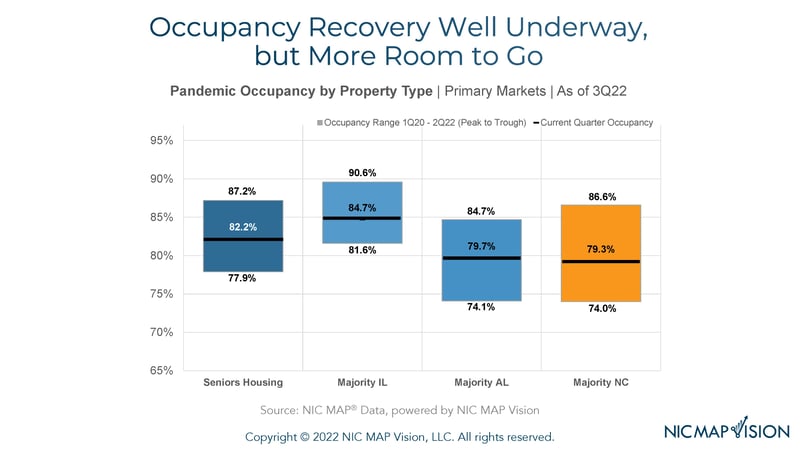
- The graph below helps to provide perspective on the pace of recovery to date for each property type and how far they must go to get back to pre-pandemic 1Q 2020 occupancy levels.
- For Senior Housing, occupancy had fallen 9.3 percentage points from its peak of 87.2% in the first quarter of 2020 to its nadir of 77.9% in the second quarter of 2021 and has since recovered 4.3 percentage points to reach 82.2% in the third quarter of this year. This means that another 5.0 percentage points of occupancy must be recovered.
- The strongest recovery to date has been Assisted Living. Overall, occupancy is up 5.6 percentage points from its low point of 81.6%, but it remains 4.9 percentage points below its Q1 2020 pre-pandemic level of 84.6%.
- At 84.7% in the third quarter of 2022, Independent Living occupancy was 3.0 percentage points above its low point, but remained 4.9 percentage points below its pre-pandemic peak, the same as for Assisted Living.
- And lastly, Nursing Care occupancy fell a very large 12.6 percentage points and has thus far recovered 5.3 pp of occupancy, but it remains furthest behind its pre-pandemic occupancy at 79.3%, with a 7.3 percentage point gap.

Takeaway #4: Construction Activity Still Slow in Most Markets
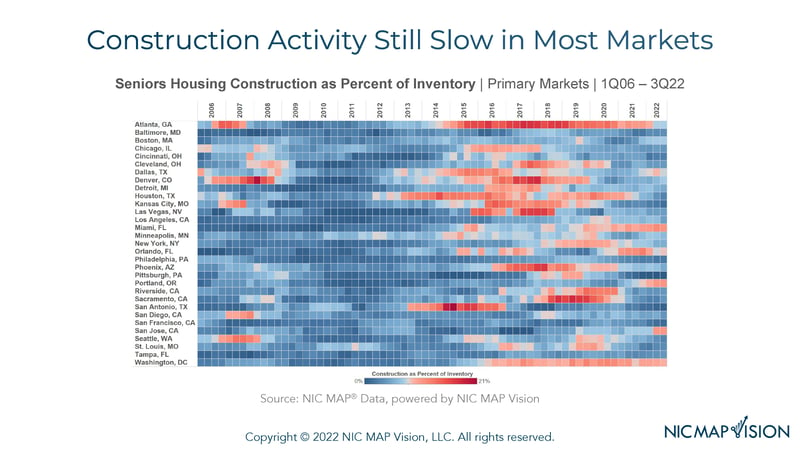
- The heat map below shows which metropolitan markets are experiencing the most construction activity. The generally blue tones on the right side of the chart indicate that construction activity is relatively “cool” in many markets.
- Looking at the right-hand part of the grid, those markets that are shaded brighter red are seeing the most construction as a share of inventory. This includes Miami, Portland, San Jose where construction as a share of inventory amounted to 11.0% in the third quarter.
- At the other end of the spectrum are markets where there is very little construction underway; this includes Pittsburgh, San Antonio, San Francisco, all less than 1%.
- For perspective, for senior housing, this equals 5.0% of inventory for the Primary Markets and it peaked at 7.3% in late 2019.

Takeaway #5: Transaction Volumes Weak Through the Third Quarter
- Total transaction volumes equaled $5.9 billion through the third quarter of 2022. In the third quarter alone, there were $1.1 billion of deals closed. If the third quarter figure were to hold, volume would be down 63% from the much stronger showing in the second quarter of $3.0 billion and it would be the weakest quarterly volume since the first quarter of 2010! Note that this data does not include deals that have been announced, only closed transactions and it is preliminary data. However, the data and certainly anecdotes, indicate that momentum in the transactions market has slowed sharply.
- Indeed, there is much conversation of buyers becoming more hesitant as the cost of debt increases significantly and therefore changes the investment return expectations and underwriting models, including the price buyers are willing to pay. In addition, there has been much discussion about deal delays as banks become more cautious due to the capital market volatility, rising interest rate markets and uncertainty about pricing.
- In terms of the buyers, the third quarter was again dominated by the private buyers and that has been the case for quite some time, although 2021 did see some public REIT activity.
- Of the $1.1 billion closed in the third quarter, private buyers represented $637 million of that, or 57% of the closed volume in the third quarter. Public buyers represented 20% and institutional buyers accounted for 17%.
- Private capital has been a steady source of capital for many years, especially the private partnerships and family regional owner/operators that have been a steady source of liquidity. However, we are now coming into a different paradigm in terms of the real estate investment markets as interest rates and inflation continue to pressure overall liquidity and it will be interesting to see if private capital continues to dominate over the next few quarters.
Interested in learning more?
- While the full key takeaways presentation is only available to NIC MAP clients with access to NIC MAP data, you can access the abridged version of the 3Q22 Data Release Webinar & Discussion featuring my exclusive commentary below.
- View the Abridged Slides Presentation.
About Beth Mace
Beth Burnham Mace is a special advisor to the National Investment Center for Seniors Housing & Care (NIC) focused exclusively on monitoring and reporting changes in capital markets impacting senior housing and care investments and operations. Mace served as Chief Economist and Director of Research and Analytics during her nine-year tenure on NIC’s leadership team. Before joining the NIC staff in 2014, Mace served on the NIC Board of Directors and chaired its Research Committee. She was also a director at AEW Capital Management and worked in the AEW Research Group for 17 years. Prior to joining AEW, Mace spent 10 years at Standard & Poor’s DRI/McGraw-Hill as director of its Regional Information Service. She also worked as a regional economist at Crocker Bank, and for the National Commission on Air Quality, the Brookings Institution, and Boston Edison. Mace is currently a member of the Institutional Real Estate Americas Editorial Advisory Board. In 2020, Mace was inducted into the McKnight’s Women of Distinction Hall of Honor. In 2014, she was appointed a fellow at the Homer Hoyt Institute and was awarded the title of a “Woman of Influence” in commercial real estate by Real Estate Forum Magazine and Globe Street. Mace earned an undergraduate degree from Mount Holyoke College and a master’s degree from the University of California. She also earned a Certified Business Economist™ designation from the National Association of Business Economists.
Connect with Beth Mace
Read More by Beth Mace