
Insights in Seniors Housing & Care
By: Beth Mace and Omar Zahraoui | July 30, 2021
Market Trends | NIC MAP Vision | Senior Housing | Skilled Nursing
The recently released NIC MAP® Data, powered by NIC MAP Vision, show that the seniors housing occupancy rate remained unchanged for the aggregated 31 NIC MAP Primary Markets in the second quarter of 2021. However, a recent analysis by NIC Analytics digs further and finds a substantial rise in the share of properties with increasing occupancy rates in 2Q2021.
Notably, 47.1% of seniors housing properties within the NIC MAP Primary markets reported an increase in occupancy rates in 2Q2021 compared with 1Q2021, a relatively higher proportion compared with levels seen during the pandemic and the most since 2Q2019 (pre-pandemic levels). This shows that positive demand is returning, consumer confidence is building, and suggests that the outlook for seniors housing occupancy remains optimistic.
In this blog, we examine occupancy change at the most granular level within the NIC MAP Primary Markets aggregate and across select metropolitan markets to assess seniors housing properties’ performance and occupancy growth.
Top Findings:
Following the onset of the pandemic in March 2020, the share of seniors housing properties reporting an increase in occupancy rates was 22.5% in 2Q2020, down from 38% in the pre-covid 1Q2020 and the lowest share since NIC began reporting data in 2005. On the other hand, 58.1% of properties reported a decrease in occupancy, the highest share since NIC began reporting data.
As the pandemic continued to evolve, the share of properties reporting an increase in occupancy rates began to gradually improve in 3Q2020 and 4Q2020. Conversely, the share of properties reporting a decrease in occupancy began to gradually decrease over the same period. In fact, based on this occupancy measure, about one-third of seniors housing properties within the 31 Primary Markets have been “pandemic-resilient” in the fourth quarter of 2020 and the first quarter of 2021.
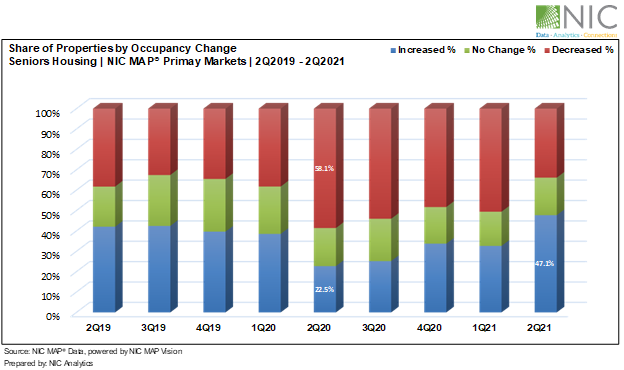
Aggregate Market Performance. Exhibit 1 below shows that seniors housing properties began to see promising signs of rebound in 2Q2021. This has translated to improvements in occupancy rates within 47.1% of seniors housing properties within the aggregated 31 NIC MAP Primary Markets average and across twenty of the 31 Primary Markets.
Notably, the share of properties reporting an increase in occupancy rate improved across 30 of the 31 Primary Markets in the second quarter of 2021, although aggregated occupancy for seniors housing in the Primary Markets was unchanged at 78.7%. This is largely due to new inventory and dispersion in demand growth between properties. Both inventory and the total number of occupied units for the 31 Primary Markets grew by about 0.7% from 1Q2021 levels.
At the market level, 8 of the 31 Primary Markets saw continued downward pressure on occupancy rates. New inventory is an important factor driving occupancy growth. As positive demand continues to build momentum and net absorptions exceeds inventory growth, the NIC MAP Primary Markets aggregate should begin to see an improvement in occupancy, but the recovery is likely to vary by market according to variations in local supply and demand conditions.
Exhibit 1 – Share of seniors housing properties by occupancy change within the NIC MAP Primary Markets.
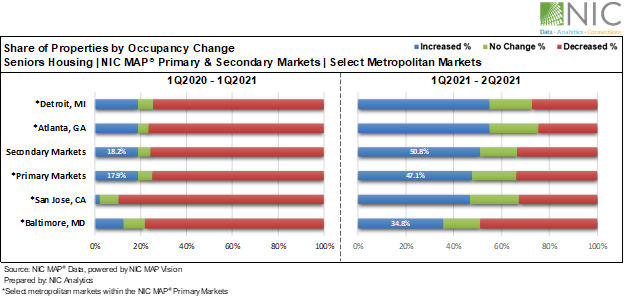
Market-Specific Performance. From 1Q2020 to 1Q2021, about 18% of properties within the 31 Primary Markets and 18% of properties within the 68 Secondary Markets aggregates reported an increase in occupancy rates. In 2Q2021, the shares of properties reporting improvements in occupancy rates from 1Q2021 for the 31 Primary Markets and 68 Secondary Markets increased substantially and was 47.1% and 50.8%, respectively.
Drilling deeper into select metropolitan markets within the NIC MAP Primary Markets, Detroit and Atlanta had the largest share of properties reporting an increase in occupancy rates at about 55% in the second quarter of 2021, while Baltimore had one of the smallest shares at 34.8%. In fact, occupancy in Baltimore continued to slip further from 81.1% in 1Q2021 to 79.6% in 2Q2021. The occupancy drop in Baltimore was largely due to negative absorption.
Interestingly, San Jose, one of the hardest-hit markets during the pandemic, had a noteworthy improvement in the share of properties reporting increasing occupancy rates in 2Q2021. The average occupancy rate in San Jose improved by 0.4pps from 83.3% in 1Q2021 to 83.7% in 2Q2021 but remains 11.1pps below March 2020 levels and very low by historic standards. The slight improvement in occupancy rates in San Jose was mainly driven by negative inventory growth associated with units being pulled off the market.
Exhibit 2 – Share of seniors housing properties by occupancy change within the NIC MAP aggregates and select metropolitan markets.
The path of future occupancy patterns is going to be shaped by supply-demand balances, and the full recovery depends on the course of the pandemic, vaccination rates, economic growth, ease of development and a restoration of consumer confidence.
To learn more about which of the NIC MAP Primary Markets performed better at the property level during the pandemic and to learn more about NIC MAP Data, powered by NIC MAP Vision, and the additional underlying data only available to NIC MAP clients, schedule a meeting with a product expert today.
Beth Burnham Mace is a special advisor to the National Investment Center for Seniors Housing & Care (NIC) focused exclusively on monitoring and reporting changes in capital markets impacting senior housing and care investments and operations. Mace served as Chief Economist and Director of Research and Analytics during her nine-year tenure on NIC’s leadership team. Before joining the NIC staff in 2014, Mace served on the NIC Board of Directors and chaired its Research Committee. She was also a director at AEW Capital Management and worked in the AEW Research Group for 17 years. Prior to joining AEW, Mace spent 10 years at Standard & Poor’s DRI/McGraw-Hill as director of its Regional Information Service. She also worked as a regional economist at Crocker Bank, and for the National Commission on Air Quality, the Brookings Institution, and Boston Edison. Mace is currently a member of the Institutional Real Estate Americas Editorial Advisory Board. In 2020, Mace was inducted into the McKnight’s Women of Distinction Hall of Honor. In 2014, she was appointed a fellow at the Homer Hoyt Institute and was awarded the title of a “Woman of Influence” in commercial real estate by Real Estate Forum Magazine and Globe Street. Mace earned an undergraduate degree from Mount Holyoke College and a master’s degree from the University of California. She also earned a Certified Business Economist™ designation from the National Association of Business Economists.
Omar Zahraoui, Principal at the National Investment Center for Seniors Housing & Care (NIC), is a seniors housing research professional with expertise in providing quantitative analysis and insights on seniors housing & care market data; building new products and reporting capabilities, including dashboards and proformas for clients and internal stakeholders; and implementing new processes and data solutions. Prior to his current role, Omar worked as a data analyst, at Calpine Corporation, supporting the development of new-business strategy initiatives, analyzing sales and financial data, and developing statistical modeling of consumers’ behaviors to drive business performance. Omar holds a Bachelor’s degree in Business Administration with concentrations in Finance and Management, a Master in Corporate Finance from IAE Lyon School of Management at Jean Moulin Lyon III University in France, and a Master of Science in Management Information Systems and Data Analytics from Pace University.
Connect with Beth Mace and Omar Zahraoui