Insights in Seniors Housing & Care
In evaluating the attractiveness of a market for seniors housing investment or development, supply and demand metrics are fundamental data to examine, and layering on an assessment of rent growth and occupancy may provide additional insight. The following analysis shows the relationships between average occupancy rates and rent growth patterns for assisted living over a four-year timeframe—from 3Q 2015 through 3Q 2019—for the NIC MAP® 31 Primary Markets in aggregate—and then looks at the relative performance of individual markets.
The four-year timeframe provides a recent look-back at the time series’ peak assisted living rent growth, inventory growth and absorption, and the time series’ low occupancy rate. The abbreviated time frame seeks to mitigate any potential confounding effects of the Great Recession on the market fundamentals. As the data is considered, it is important to note that the results would differ if the study took a one-year, two-year, or ten-year look-back, with greater or lesser fluctuations in market dynamics on display with various timeframes.
Market-level occupancy and rent growth performance
As shown in the following chart, data was plotted for the four-year timeframe (3Q 2015 to 3Q 2019) to understand the relative performance of rent growth and occupancy trends for each of the 31 NIC MAP Primary Markets. The chart displays each market’s performance relative to each other and to the Primary Markets’ average for annual same store asking rent growth and average occupancy for this four-year period (for the Primary Markets, rent growth averaged 3.0% over this period, while the occupancy rate averaged 86.5%). The differing colors for the markets’ marks is simply to help distinguish each market’s plotting relative to that of the others.
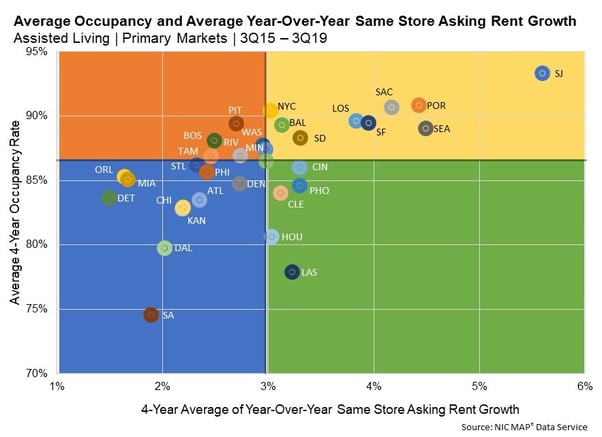
The strongest performing markets—those with the highest assisted living average annual asking rent growth rates and highest average all occupancy rates for the four-year timeframe included San Jose, Portland, Sacramento, New York City, Los Angeles, San Francisco, Baltimore, Seattle and San Diego. Many of these markets have limited supply due to constraints such as significant land development regulations, physical constraints on geographical expansion, and extended entitlement processes and/or premium prices on land due to scarcity. Building seniors housing may also not be considered the highest and best use of land, with other types of real estate taking priority. Investors and developers in markets with these characteristics tend to have a long-term hold strategy and are typically rewarded with the ability to maintain or command higher rents because of relatively more restricted competition.
The weakest performing markets—those with the lowest assisted living average annual asking rent growth rates and lowest average all occupancy rates for the four-year timeframe included Detroit, Orlando, Miami, San Antonio, Dallas, Chicago, Kansas City, St. Louis, Atlanta, Philadelphia, and Denver. What do these markets have in common? A simple answer may not be enough as there may be a variety of influences, including but not limited to, demand fluctuations, several consecutive quarters of sustained construction, price pressures from new seniors housing inventory competition or oversupply, lost market share to alternative options for housing and/or care such as age-restricted multifamily apartments, home health services, co-housing, aging-in-place technology, and adverse local economic conditions.
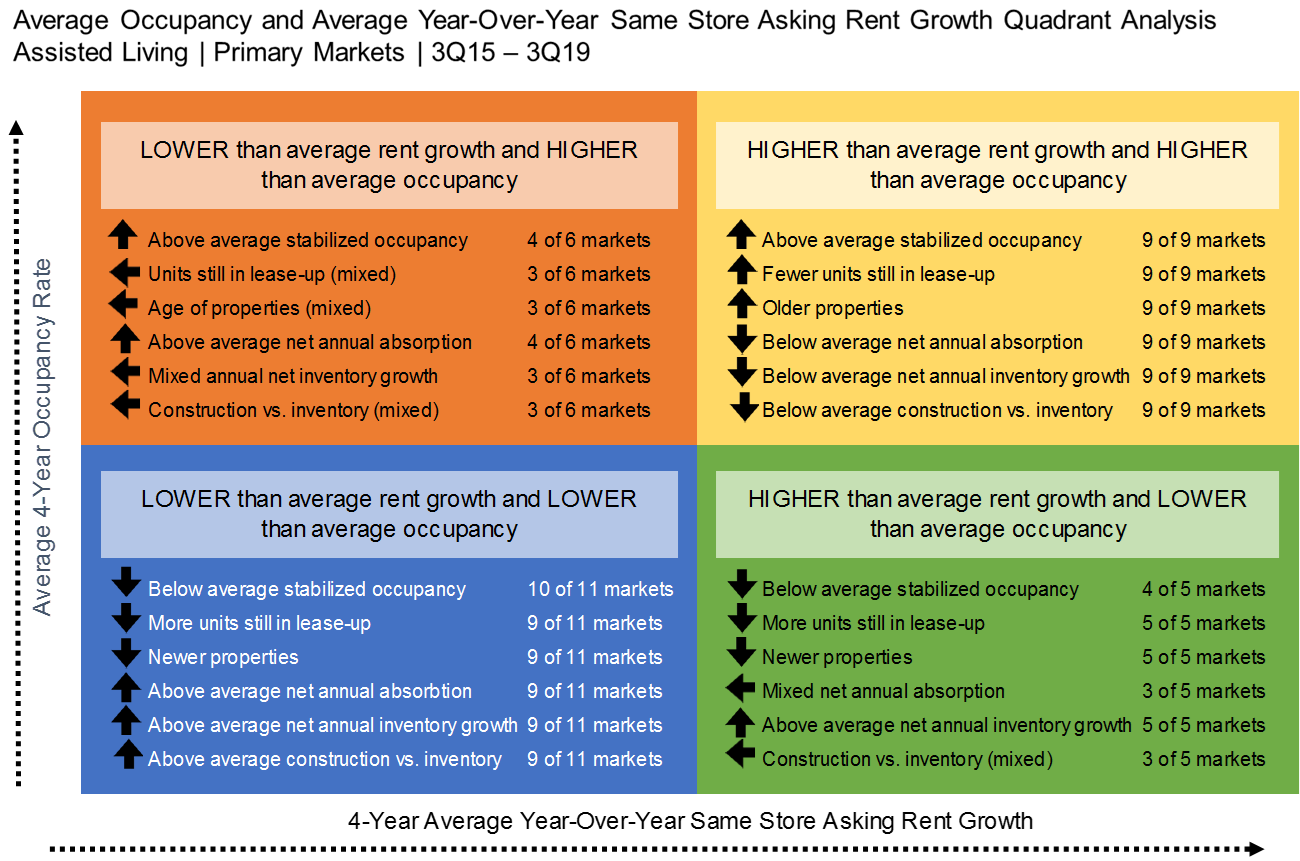
The table below describes the commonalities of each quadrant in the scatterplot chart discussed above for the four-year timeframe. In addition to the assisted living all occupancy rates and average annual same store asking rent growth rates that were diagrammed in the scatterplot chart, stabilized occupancy (defined by NIC as properties that have been open for at least two years or, if open for less than two years, have already reached a 95% occupancy), the percent difference (i.e. “gap”) between the all and stabilized occupancy rates (which denotes the percentage of units still in lease-up), average age of properties in the market, net annual absorption growth, net annual inventory growth and construction as a share of inventory were examined for each of the 31 Primary Markets to suggest potential patterns for further exploration.
Source: NIC MAP® Data Service
Despite the recent softening in assisted living occupancy and rent growth over the four year timeframe, some markets have experienced high rent growth matched with high occupancy, some have seen low rent growth matched with low occupancy, and others have experienced high occupancy and low rent growth, or low occupancy and high rent growth. What are some of the potential connecting factors?
Markets with either (1) strong absorption of new inventory, (2) a lull in cyclical construction, and/or (3) high barrier to-entry markets with limited new stock often have higher occupancy rates and can typically command higher rates of annual rent growth. In contrast, saturated markets—and markets with sustained construction cycles—may experience suppressed rent growth and lower occupancy rates for multiple years until demand catches up with supply. Under such conditions, operators may struggle to attract enough residents to fully lease-up a market’s new and existing units and may react to occupancy pressures by wholesale reductions in asking rents, and/or by offering point of sale concessions to offset and moderate revenue lost to vacancies.
Indeed, this analysis and blog post has only scratched the surface. Several questions may need to be answered with further research to understand what the key drivers of rent growth at the market-level are, including but not limited to:
This blog has pointed out the wide differences in market performance by occupancy and rent growth and has suggested possible explanations for some of the disparities. However, to more fully understand rent and occupancy performance by market, an exploration of local market conditions and individual market dynamics should be considered.
If you’d like to learn more about the NIC MAP® Data Service, click here to visit our NIC MAP website.
Lana Peck, former senior principal at the National Investment Center for Seniors Housing & Care (NIC), is a seniors housing market intelligence research professional with expertise in voice of customer analytics, product pricing and development, market segmentation, and market feasibility studies including demand analyses of greenfield developments, expansions, repositionings, and acquisition projects across the nation. Prior to joining NIC, Lana worked as director of research responsible for designing and executing seniors housing research for both for-profit and nonprofit communities, systems and national senior living trade organizations. Lana’s prior experience also includes more than a decade as senior market research analyst with one of the largest senior living owner-operators in the country. She holds a Master of Science, Business Management, a Master of Family and Consumer Sciences, Gerontology, and a professional certificate in Real Estate Finance and Development from Massachusetts Institute of Technology (MIT).
Connect with Lana Peck