As in all real estate, “its local” for seniors housing as well. Indeed, while the seniors housing occupancy rate remained at a six-year low rate of 87.9% in the third quarter, not all markets were weak. There was a very wide disparity between the best and poorest performing markets with a 13.8 percentage point variance between the most occupied market (San Jose: 94.6%) and the least occupied market (Houston: 80.8%) in the third quarter. Every market performs differently as unique conditions and factors contribute to disparate development and demand patterns at the local and metropolitan market level.
The chart below provides details of the supply and demand dynamics for the NIC MAP 31 Primary Markets in the past three years. The vertical axis shows annual inventory growth in percentage terms, while the horizontal axis shows annual net absorption growth for the past three years. The color of the circle depicts the movement of the occupancy rate over the past year: red for a deteriorating occupancy rate and green for an improving occupancy rate. The size of the circle shows how many absolute units were added to inventory in the past three years.
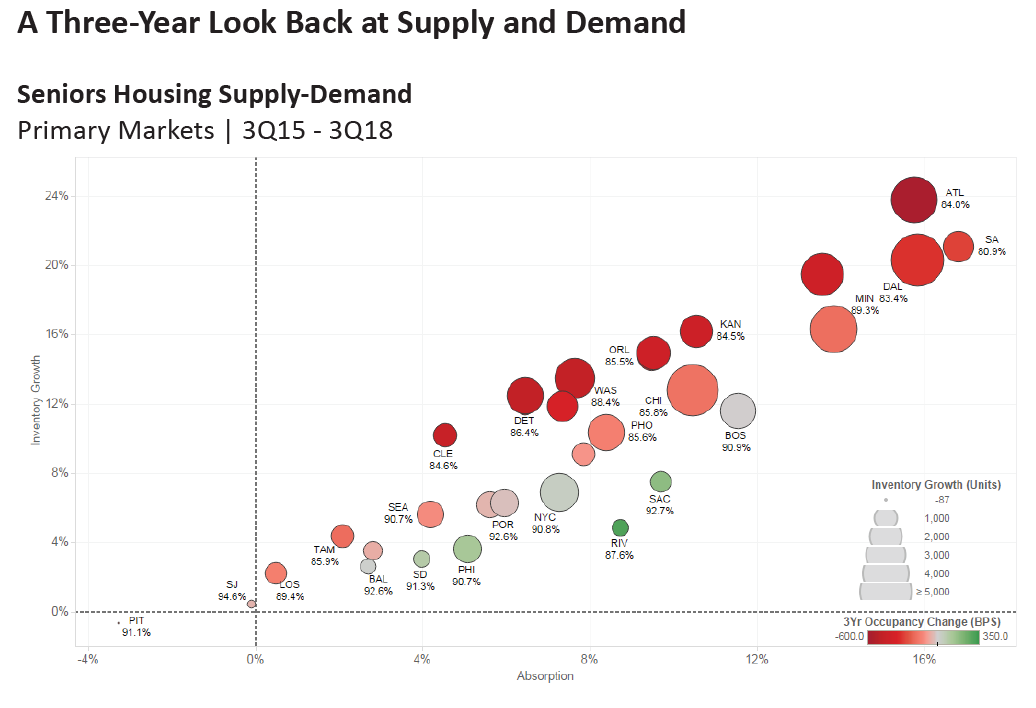
In the past three years, Houston, Atlanta, San Antonio and Dallas have all seen inventory grow by 20%, while Minneapolis, Kansas City, Denver and Orlando have seen a 15% increase in stock. In all these metropolitan markets, occupancy has fallen between two and six percentage points as the pace of new inventory growth has exceeded that of demand.
The strongest net absorption occurred in many of the markets that experienced the fastest growth in inventory. In the chart, this can be identified by the markets furthest to the right. This includes San Antonio, Dallas, Atlanta, Minneapolis, Houston and Kansas City. The fact that these circles are also red, however, shows that occupancy declined in these markets over the past three years and that, while demand was strong, it simply was not “strong enough.” However, there is a good chance that demand will start to catch up in some of these markets because projects currently under construction have declined significantly. This is particularly the case in San Antonio, which had less than 100 units under construction as of the third quarter.
The flip side is metropolitan areas that have not seen very much inventory growth and have seen occupancy rate improvement in the past three years. This includes Riverside, Sacramento, Philadelphia, Baltimore, San Diego and New York.
In terms of absolute unit growth over the past three years, the most unit inventory gains occurred in Dallas, Chicago, Minneapolis, Atlanta and Houston–those markets with the largest red circles in the chart. These five geographies accounted for 40% of the 54,000 units of inventory growth in the NIC MAP Primary Markets in the past three years. Behind this top five group are Washington DC, New York City, Detroit, Phoenix, and Boston. The top 10 markets for inventory growth accounted for 63% of inventory growth in the past three years. Offsetting these trends are markets with relatively little inventory growth over the past three years which include San Jose, Baltimore, Las Vegas, San Diego, Riverside, and Pittsburgh.
Taken together, this analysis supports the maxim that all real estate is local and that broad aggregate trends can obscure opportunities. It would appear that the much-ballyhooed supply story of San Antonio has been paid heed and units under construction currently have slowed dramatically, providing a pause in inventory growth to allow demand to catch up and occupancy to rise above 81%. Meanwhile, Phoenix currently has the most absolute number of units under construction at 3,524 units or 13.9% of its inventory, dwarfing the 2,368 units completed in the past three years. Eight other markets have greater amounts of units under construction today than what was completed in the past three years. Other than Phoenix, this includes Baltimore, San Diego, Riverside, Sacramento, Los Angeles, Philadelphia, New York, and Miami. These markets bear watching and deserve further examination to determine if demand in these markets will in fact be “strong enough.”