NIC MAP® Data Service clients attended a webinar in mid-April on the key seniors housing data trends during the first quarter of 2018. Key takeaways included the following.
Takeaway #1: Seniors housing occupancy fell to 88.3%
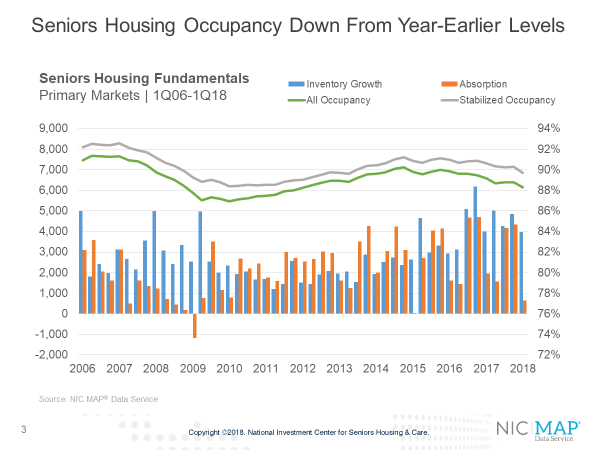
The all occupancy rate for seniors housing, which includes properties still in lease up was 88.3% in the first quarter, down 90 basis points from 89.2% in the first quarter of 2016 and down 50 basis points from the fourth quarter. This was the lowest occupancy rate in six years. Notably, assisted living occupancy fell to a record low rate of 85.7% in the first quarter.
The quarterly decline in the overall occupancy rate stemmed from a marked slowdown in first quarter absorption as well as less inventory growth. Winter weather typically causes a slowdown in both inventory growth and demand in the first quarter. This year, a particularly harsh flu season may have also slowed leasing activity as many properties lost marketing days due to flu-related property-level quarantines.
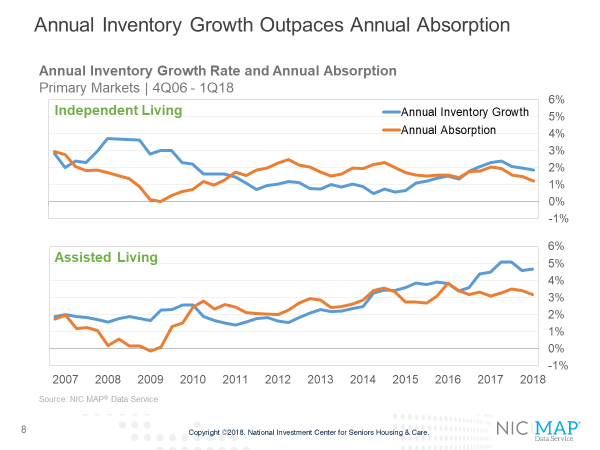
Takeaway #2: Annual inventory growth outpaced annual absorption for both assisted living and independent living
Assisted living inventory growth has been ramping up for a longer period than independent living in the Primary Markets. In mid-2012, the occupancy rate of independent living was the same as for assisted living at 88.8%. Since that time, there has been a clear divergence in occupancy performance reflecting the differences in supply growth and demand for the two property types. For majority independent living properties, inventory growth exceeded absorption by 70 basis points in the first quarter—1.9% versus 1.2%. The occupancy rate for majority independent living properties was 90.3% in the fourth quarter. Annual inventory growth for majority assisted living properties was 4.7%, up a bit from the fourth quarter. Annual absorption slipped back to a pace of 3.2%.
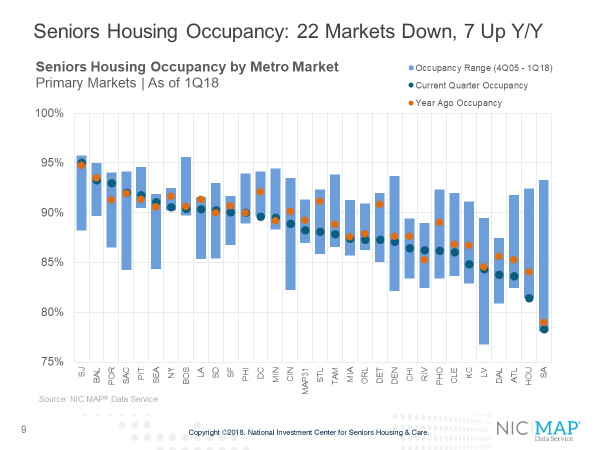
Key Takeaway #3: Seniors Housing Occupancy: Twenty-two markets down, seven up year over year
The following slide shows a comparison of occupancy rates among the Primary Markets. The blue dot shows the current occupancy rate, and the orange dot shows the year-ago occupancy rate. The top of the blue bar shows the all-time highest occupancy rate by market, and the bottom of the blue line shows the all-time low.
Fifteen markets had occupancy rates higher than the Primary Market average. Starting on the left is the market with the highest first-quarter occupancy rate: San Jose, at 95.1%. After San Jose, the highest occupancy levels are in Baltimore, Portland, Sacramento, Pittsburgh and Seattle, all markets with occupancy rates above 91%. At the other end of the spectrum are San Antonio, with an occupancy of 78.3%, followed by Houston, Atlanta Dallas, Las Vegas and Kansas City, all with occupancy rates below 85.0%.
Twenty-two of the thirty-one markets had occupancy rates lower than year-earlier levels, while seven markets had higher occupancy rates than one year ago and two were unchanged (Sacramento and Philadelphia). The most significant deterioration occurred in Detroit (down 360 basis points to 87.3%), St. Louis (down 3 full percentage points from 91.1% to 88.1%), Phoenix, Houston and Washington DC. The most improvement occurred in Portland Oregon where occupancy increased by 1.7 percentage points to 93.0%, while Riverside was up 1.0 percentage points to 86.3%.
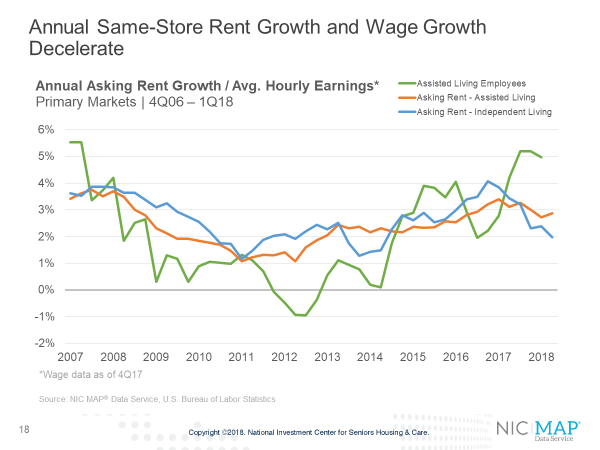
Key Takeaway #4: Same-store rent growth decelerated
Same-store asking rent growth for seniors housing decelerated in the first quarter, with year-over-year growth of 2.3%. This was down from 3.7% in the fourth quarter of 2016 when it reached a cyclical peak and the smallest increase since early 2014. Asking rent growth for assisted living was 2.9% for the first quarter, up 20 basis points from the fourth quarter. For independent living, rent growth slipped back to 2.0%, half the 4.1% pace it achieved in the third quarter of 2016 when rent growth reached its highest pace since NIC began collecting this data.
According to the U.S. Bureau of Labor Statistics, average hourly earnings were up 5.0% for assisted living employees as of Q4 2017. Together, these lines show the pressure operators may be having as expense growth has been pressured higher, while rent growth has been easing. For many operators, labor expenses amount to 60% of their expenses.
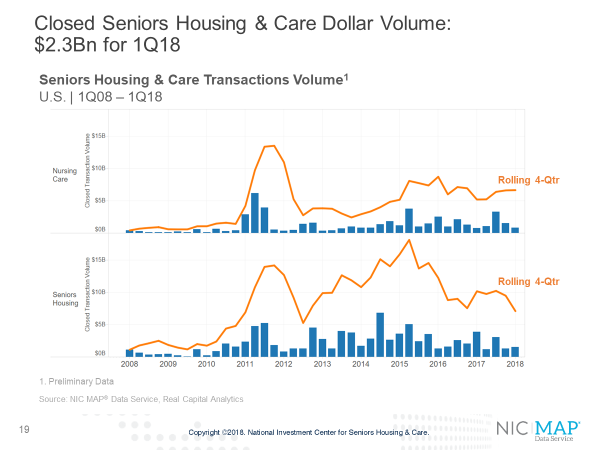
Key Takeaway #5: Closed Seniors Housing & Care Dollar Volume: $2.3Bn for 1Q18
Seniors housing and care transactions volume totaled $2.3 billion in the first quarter based on preliminary estimates. That includes $1.5 billion for seniors housing and $800 million in nursing care transactions. The total volume was down 17% from the previous quarter’s $2.8 billion and down 50% from the first quarter of 2017 when volume came in at $4.7 billion.
The first quarter of the year is usually one of the weakest quarters in volume, due to the usual rush to close deals at the end of the year, leaving the pipeline a bit empty flowing into the first quarter. There were some other dynamics at play as well toward the end of last year with tax reform but the first quarter of 2018 was relatively quiet overall, even with these preliminary figures.
A few relatively notable transactions in the first quarter were:
- Invesque (Toronto-based group) bought 40 properties from Care Investment Trust including mostly seniors housing units but some skilled nursing beds to total over 3,300 units /beds for over $400 million, and
- Cascade/KKR JV bought 18 seniors housing properties from Welltower for a little over $300 million including over 1,400 units.