Penetration rates vary across markets and across time. Some of the variation may be due to differing demand factors such as population and household growth and size, consumer preferences, familiarity and comfort with the product, changes in the composition of inventory, and cultural influences. This blog post explores some of this variation.
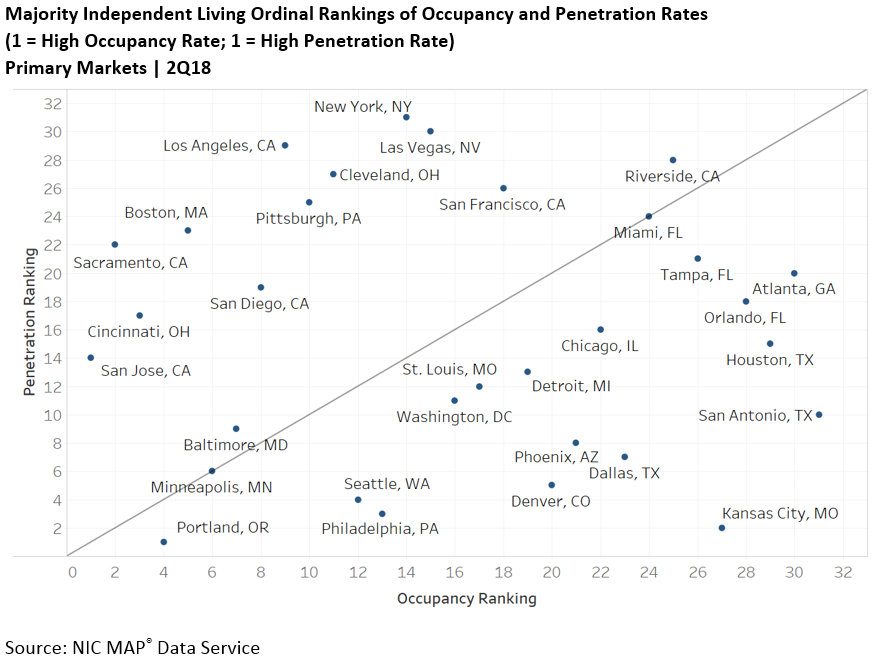
The chart above shows the ordinal ranking of occupancy rates and penetration rates for the Primary 31 markets for Majority Independent Living (IL) properties as of 2Q2018 from the NIC MAP® client portal. Although one might expect areas with high occupancy to also have high penetration, the data show that is not always the case and that there is variation in the relationship between occupancy rates and penetration rates.
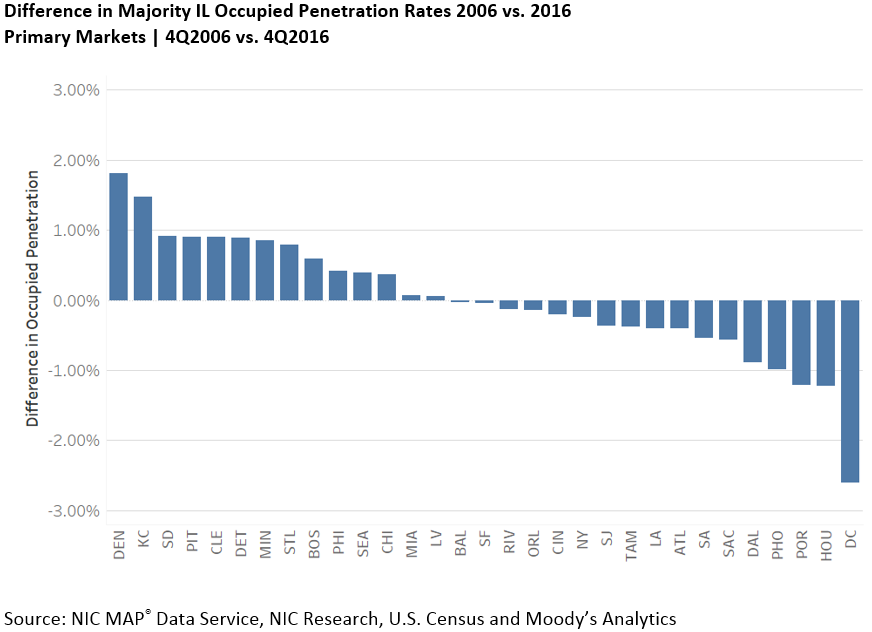
Penetration rates over time: Some have risen, some have fallen. An analysis of metropolitan market penetration rates across time that uses NIC MAP seniors housing inventory and occupancy data and time series household demographic data from the U.S. Census and Moody’s Analytics reveals interesting results1 This analysis calculates two types of penetration time series: occupied penetration (calculated as the number of occupied units divided by households age 75+) and supply penetration (open inventory divided by households age 75+). After calculating the supply penetration rate and occupied penetration rate time series for the Primary 31 Markets, we also calculated the respective changes from 4Q2006 to 4Q2016 for each metropolitan market.
The data show wide differences in penetration rates by geography, with high penetration rates for Majority IL, Portland, Oregon; Philadelphia; Kansas City; and Seattle ranked high, while Los Angeles; Riverside; New York; and Las Vegas ranked low.
The analysis also examined changes in occupied penetration rates across time by metropolitan market. For Majority IL, 17 out of the 31 Primary Markets saw decreases in occupied penetration rates in the 10 years ending in 2016, while the other 14 showed increases. For the aggregate Primary 31 Markets, occupied penetration remained flat at 5.6% for Majority IL.
Why have some markets experienced rising penetration rates, while others have not? The answer reflects underlying supply and demand factors, such as a comparison of growth in inventory compared with growth in households over age 75, demand-related factors such as familiarity with the product, demographic patterns of both seniors and their adult children, and in some cases idiosyncratic factors unique to each metropolitan area such as cultural comfort with the product offerings. Operator reputation in a market may also help explain penetration rates. This variability reinforces how important it is to evaluate conditions at a local market level.
Conclusion. Penetration rates and occupancy rates do not have a clear-cut relationship across markets. Penetration rates can increase when inventory growth outpaces household growth. In some instances, this may result in falling occupancy rates; but in others, occupancy rates remain steady. Factors such as familiarity with the product type, marketing and education efforts, operator reputation, growth in the number of seniors and their adult children, variation in population health needs, local cost of living, affordability of product, and perhaps climate, can also influence penetration rates.
1 The Moody’s Analytics time series data for Households over age 75 based on the U.S. Census at this time is currently only available through 2016.