The following analysis examines current conditions and year-over-year changes in inventory, occupancy, and same-store asking rent growth—by care segments within CCRCs (CCRC segments) compared to non-CCRC segments in freestanding or combined communities to focus a lens on the relative performance of care segments within CCRCs during the second quarter of 2021.
The analysis leverages NIC MAP® data, powered by NIC MAP Vision, an affiliate of NIC. NIC MAP data tracks occupancy, asking rents, demand, inventory, and construction data for independent living, assisted living, memory care, skilled nursing, and continuing care retirement communities (CCRCs, also referred to as life plan communities) for more than 15,000 properties across 140 metropolitan areas. NIC MAP Data currently tracks 1,208 not-for-profit and for-profit entrance fee and rental CCRCs in these 140 combined markets (1,134 in the 99 combined Primary and Secondary Markets).
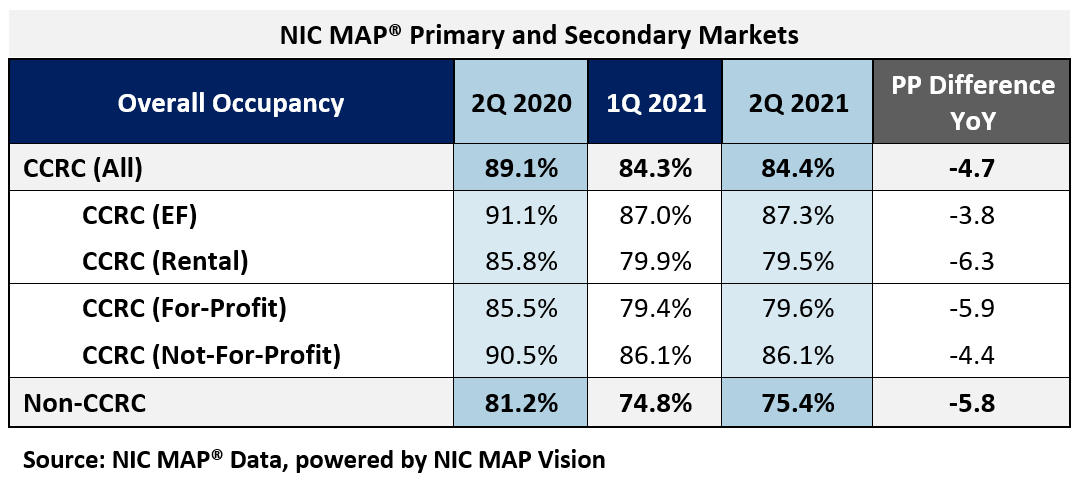
Current CCRC Occupancy by Payment Type and Profit Status
From 2Q 2020 to 2Q 2021, the cumulative drop in CCRC occupancy was 4.8 percentage points from 89.1% to 84.4%. For context, CCRC occupancy in the second quarter fell 7.1 percentage points from pre-pandemic levels (1Q 2020). Non-CCRC occupancy averaged 75.4% in 2Q 2021—a very wide 9.0 percentage points lower than CCRC occupancy. On a year-over-year basis, entrance fee CCRC occupancy (87.3%) was 7.8 percentage points higher than rental CCRCs (79.5%), and not-for-profit CCRC occupancy (86.1%) was 6.5 percentage points higher than for-profit CCRCs (79.6%).
CCRCs vs. Non-CCRCs: Care Segment Detail
The table below compares each of the care segments—independent living, assisted living, memory care and nursing care—in the Primary and Secondary Markets. The table shows the 2Q 2021 total open units, occupancy and average monthly asking rent—and year-over-year changes for CCRCs and non-CCRCs.
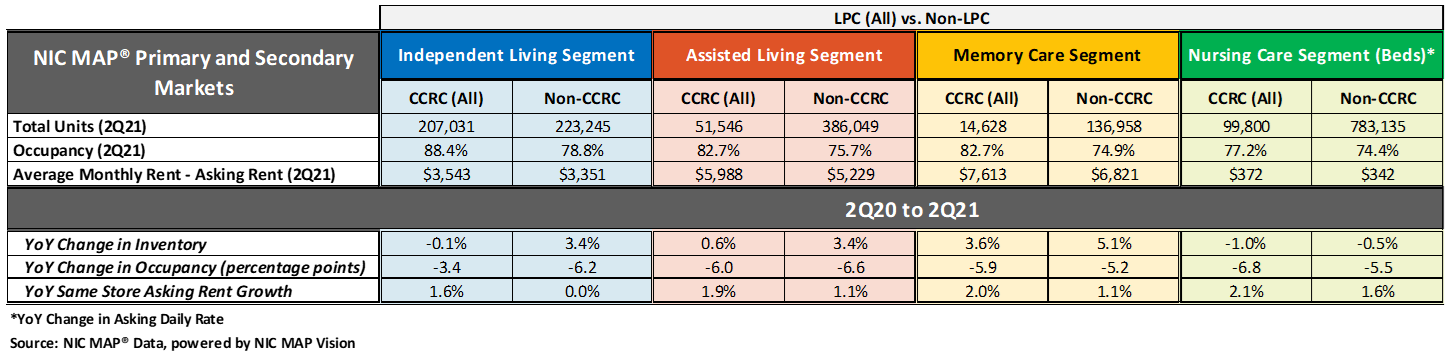
[click to enlarge]
Independent living occupancy nearly 10 percentage points higher than non-CCRC
The CCRC independent living care segment had the highest 2Q 2021 occupancy (88.4%), followed by CCRC assisted living and memory care (82.7%, respectively). The difference in 2Q 2021 occupancy between CCRCs and non-CCRCs was the highest for the independent living segment (9.6 percentage points), and the lowest for the nursing care segment (2.8 percentage points).
While overall occupancy declined from year-earlier levels for each of the care segments, CCRCs had lesser declines in overall occupancy than non-CCRCs. The differences are in part due to the relative influence of the majority inventory mix. The CCRC independent living care segment (which represents 55.5% of CCRC units) garnered the highest occupancy in the second quarter of 2021 (88.4%), as well as the smallest year-over-year drop in occupancy, falling 3.4 percentage points. The current nursing care segment occupancy rate in non-CCRCs, which represents 51.2% of non-CCRC units, was much lower at 74.4%, and fell 5.5 percentage points year-over-year.
The highest year-over-year asking rent growth was in the CCRC nursing care and memory care segments (2.1% and 2.0, respectively). The lowest was noted for non-CCRCs in the independent living care segment (0.0%). Note, these figures are for asking rates and do not consider any discounting that may be occurring.
A long-term phenomenon, CCRCs had lower rates of inventory growth (year-over-year change in inventory) by segment than non-CCRCs. Negative inventory growth was reported for CCRCs in the nursing care segment (-1.0%). Negative inventory growth can occur when units/beds that are temporarily or permanently taken offline or converted to another care segment outweigh added inventory.
Wide disparity in regional CCRC median occupancy performance
For benchmarking purposes, some investors and operators prefer to measure themselves against the median occupancy rate, assuming that the properties that support a higher median rate are of higher institutional quality. The table below illustrates the median occupancy rates in each region.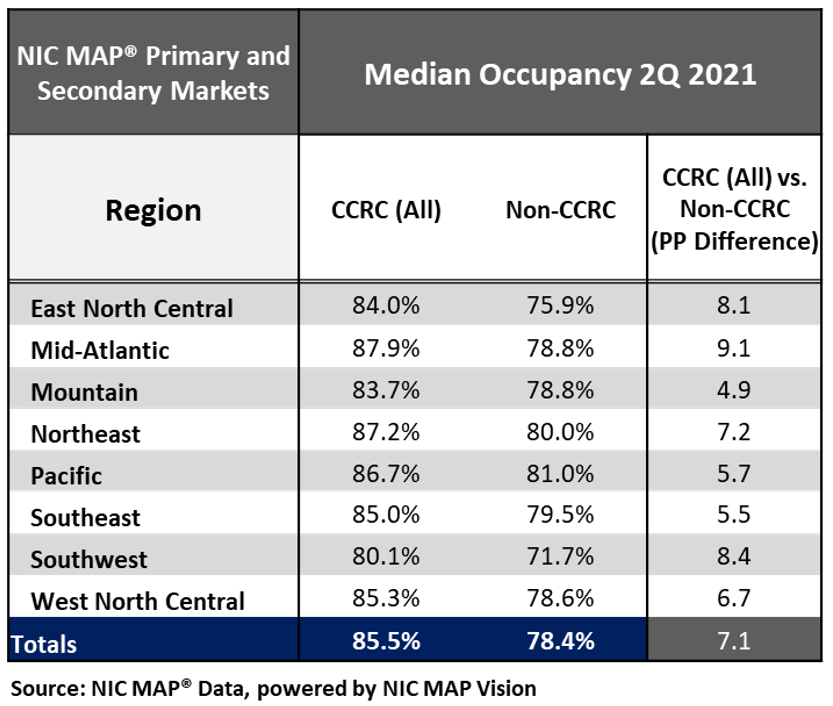
In the second quarter of 2021, three out of eight regions had median CCRC occupancy higher than the national median rate (Mid-Atlantic, Northeast and Pacific).
The strongest CCRC median occupancy rate is in the Mid-Atlantic region and the weakest is in the Southwest region. It is notable that the difference between the Southwest’s CCRC median occupancy rate (80.1%) and the Mid-Atlantic’s CCRC median occupancy rate (87.9%) is nearly eight percentage points underscoring the wide disparity in CCRC occupancy performance.
Look for future blog posts from NIC to delve deep into the performance of CCRCs.
Interested in learning more?
To learn more about NIC MAP data, powered by NIC MAP Vision, and about accessing the data featured in this article, schedule a meeting with a product expert today.
*This blog was originally published in Ziegler Investment Banking, Senior Living Finance Z-News.