The following analysis examines current conditions and year-over-year changes in inventory, occupancy, and same-store asking rent growth—by care segments within CCRCs (CCRC segments) compared to non-CCRC segments in freestanding or combined communities to focus a lens on the relative performance of care segments within CCRCs during the third quarter of 2021.
NIC MAP® data, powered by NIC MAP Vision, tracks occupancy, asking rents, demand, inventory, and construction data for independent living, assisted living, memory care, skilled nursing, and life plan communities (CCRCs) for more than 15,000 properties across 140 metropolitan areas. NIC MAP data currently tracks 1,188 not-for-profit and for-profit entrance fee and rental CCRCs in these 140 combined markets (1,112 in the 99 combined Primary and Secondary Markets).
3Q 2021 CCRC Market Fundamentals
After five quarters of negative absorption (change in occupied stock or a measure of demand) during the pandemic, CCRC unit absorption rebounded in the third quarter of 2021 to the strongest pace since 4Q 2008. This (and negative inventory growth) helped push occupancy up to 85.4%, which is 1.1 percentage points above its pandemic period low during the previous quarter, but still 6.2 percentage points below its pre-pandemic occupancy rate in the first quarter of 2020 (91.6%).
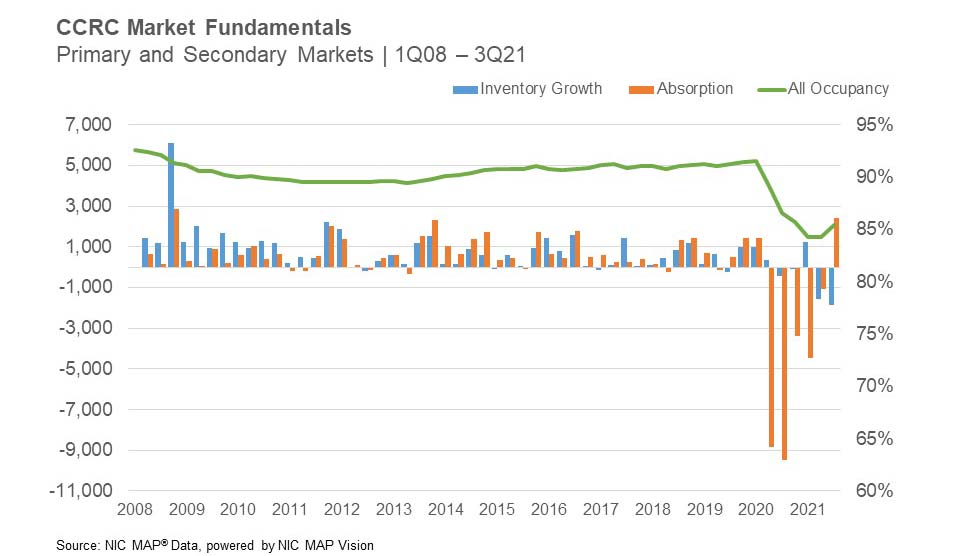
Non-CCRC occupancy averaged 77.1% in 3Q 2021—8.3 percentage points lower than CCRC occupancy. On a year-over-year basis, entrance fee CCRC occupancy (88.0%) was 6.9 percentage points higher than rental CCRCs (81.1%), and not-for-profit CCRC occupancy (87.0%) was 6.0 percentage points higher than for-profit CCRCs (81.0%).
CCRCs vs. Non-CCRCs: Care Segment Detail
The table below compares each of the care segments—independent living, assisted living, memory care and nursing care—in the Primary and Secondary Markets tracked by NIC MAP Vision. The table shows the 3Q 2021 total open units, average occupancy, average monthly asking rent—and year-over-year changes for CCRCs and non-CCRCs.
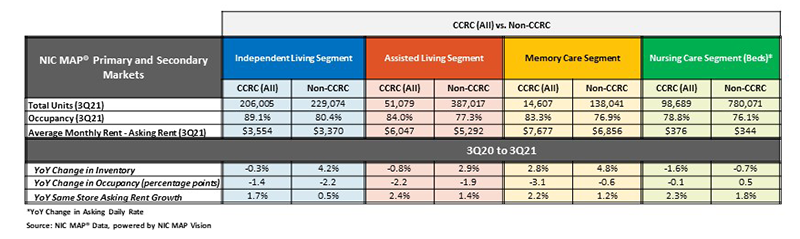
CCRCs: Stronger Occupancy and Rent Growth, Weaker Inventory Growth Than Non-CCRCs
The CCRC independent living care segment had the highest 3Q 2021 occupancy (89.1%), followed by CCRC assisted living and memory care (84.0% and 83.3%, respectively). The difference in 3Q 2021 occupancy between CCRCs and non-CCRCs was the highest for the independent living segment (8.7 percentage points), and the lowest for the nursing care segment (2.8 percentage points).
The highest year-over-year asking rent growth was in the CCRC assisted living segment, followed by nursing care and memory care (ranging from 2.4% to 2.2%). The lowest was noted for non-CCRCs in the independent living care segment (0.5%). Note, these figures are for asking rates and do not consider any discounting that may be occurring.
Negative inventory growth was reported for CCRCs in the independent living, assisted living and nursing care segments. CCRCs have had historically lower rates of inventory growth (year-over-year change in inventory) by segment than non-CCRCs. Negative inventory growth can occur when units/beds are temporarily or permanently taken offline or converted to another care segment outweigh added inventory. The highest year-over-year inventory growth was reported for the non-CCRC memory care and independent living care segments (4.8% and 4.2%, respectively).
All the New CCRC Units Under Construction are in Five Markets
Comparatively very little development of CCRCs has occurred in recent years (the median age of CCRCs is 35 years). Approximately 60% of existing CCRC units in the Primary and Secondary Markets are at properties that have been developed since 1980.
As shown below, considering all CCRC units under construction (both new and expansion units, not-for-profit and for-profit) 76% are located in four markets: Washington D.C., Austin, Memphis, and Knoxville. Construction as a share of existing inventory is highest in two Tennessee markets: Knoxville (29% or 149 units) and Memphis (21% or 299 units).
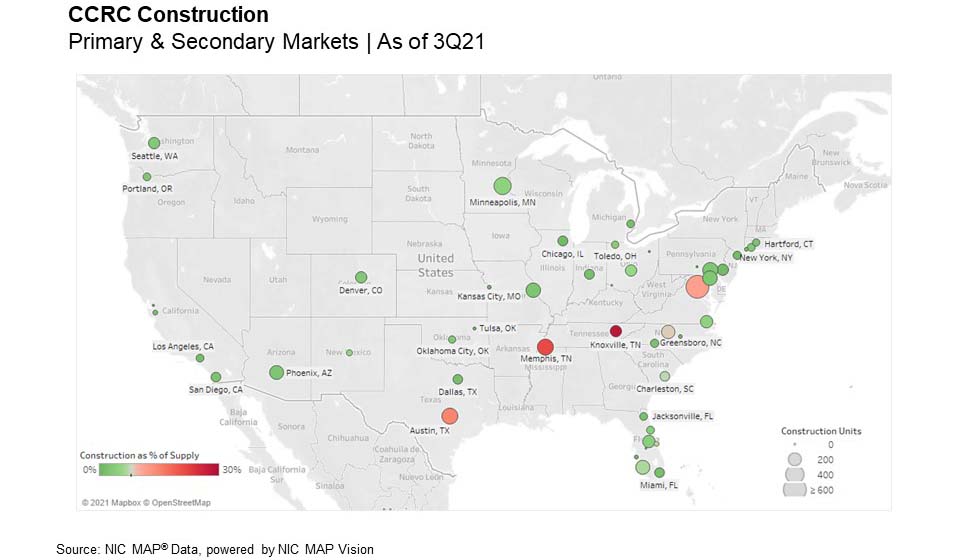
Setting aside expansion projects, the share of new CCRC units under construction in the Primary and Secondary Markets was 39% in 3Q 2021, (61% are expansions on existing properties). All the new CCRC units under construction are located in just five markets: Washington D.C., Memphis, Minneapolis, Baltimore, and Orlando. Nearly three-quarters of for-profit new CCRC construction (71% or 1,400 units) and one-half of not-for-profit new CCRC construction is in Washington, D.C. (51% or 378 units).
Look for future blog posts from NIC to delve deep into the performance of CCRCs.
Interested in learning more?
To learn more about NIC MAP data, powered by NIC MAP Vision, and about accessing the data featured in this article, schedule a meeting with a product expert today.
*This blog was originally published in Ziegler Investment Banking, Senior Living Finance Z-News.