The following analysis examines occupancy and year-over-year changes in inventory, and same-store asking rent growth—by care segment—within entrance fee CCRCs and rental CCRCs in the 99 combined NIC MAP Primary and Secondary Markets. The analysis also explores the recovery of regional occupancy rates by payment type (entrance fee CCRCs vs. rental CCRCs) as well as the distribution of occupancy rates by payment type across all care segments during the first quarter of 2023.
NIC MAP®, powered by NIC MAP Vision, collects primary data on occupancy, asking rents, demand, inventory, and construction for more than 16,100 independent living, assisted living, memory care, skilled nursing, and continuing care retirement communities (CCRCs—also referred to as life plan communities) across 140 U.S. metropolitan markets. The dataset includes about 1,160 not-for-profit and for-profit entrance fee and rental CCRCs in these 140 combined markets, including 1,078 in the 99 combined Primary and Secondary Markets.
Occupancy Trends – Entrance Fee CCRCs Lead the Way and Surge Ahead of Competition
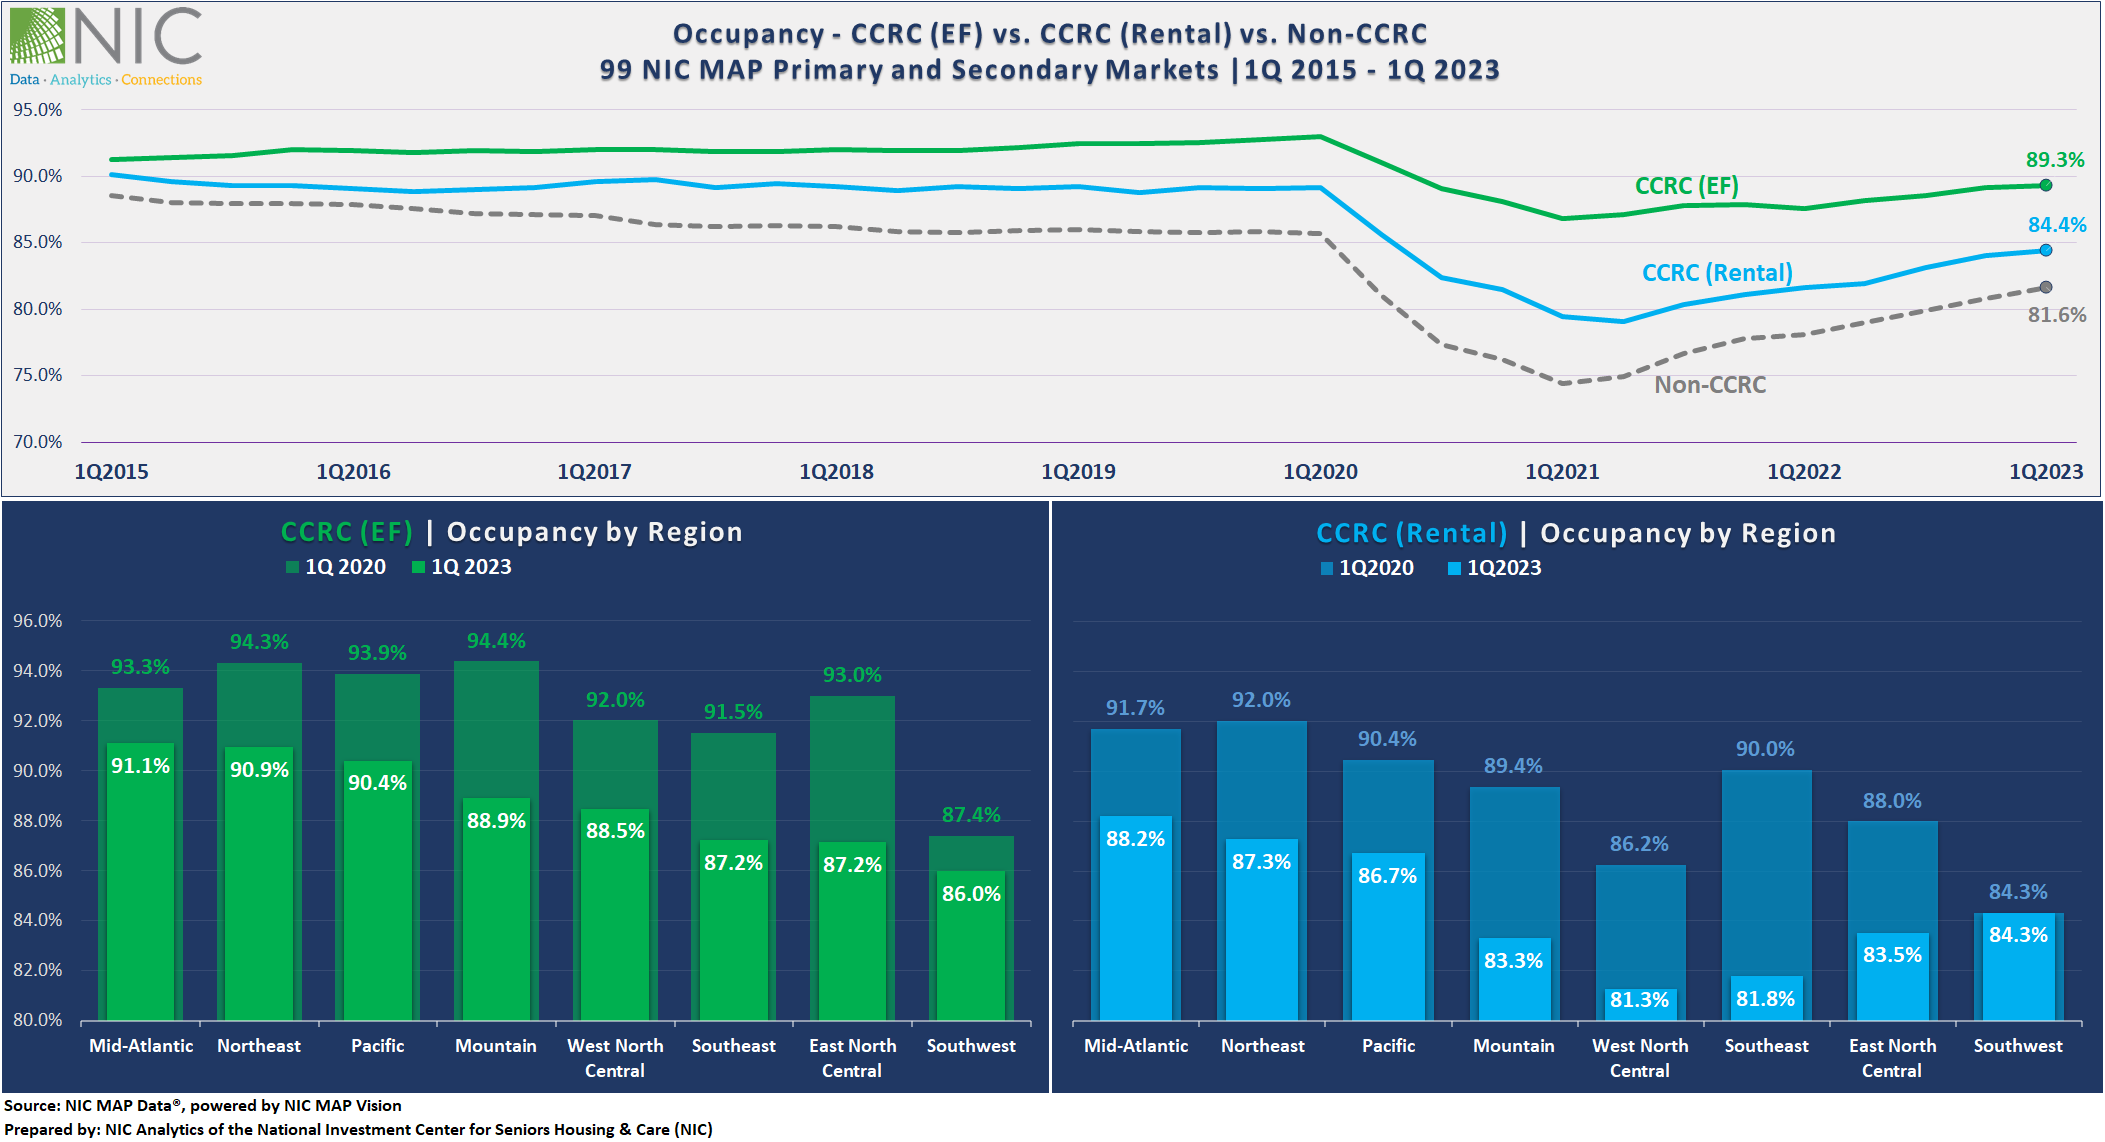
Entrance fee CCRCs have consistently outperformed rental CCRCs and non-CCRCs since NIC MAP Vision began reporting data in 2005. In the 99 NIC MAP Primary and Secondary markets, the occupancy rate for entrance fee CCRCs stood at 89.3% in the first quarter 2023, 4.9 percentage points (pps) higher than rental CCRCs (84.4%) and 7.7pps higher than non-CCRCs (81.6%).
Notably, the difference in occupancy rates between entrance fee CCRCs and rental CCRCs/non-CCRCs has been increasing since at least 2015 as the exhibit below shows, and this gap was amplified during the height of the pandemic. In fact, the occupancy differences between entrance fee CCRCs and non-CCRCs reached double digits in 2020 and 2021, with entrance fee CCRCs experiencing a relatively smaller decline in occupancy compared to non-CCRCs and rental CCRCs.
Generally, the success equation for CCRCs includes the profiles and characteristics of both residents and staff as principal components.
Residents of CCRCs are typically “life planners” and have set upon this life choice carefully and with considerable savings. The unique model of care in CCRCs often attracts younger residents with fewer health concerns and allows them to move through the continuum of care more seamlessly as acuity increases. Residents of CCRCs tend to have fewer serious health conditions upon move in and have passed medical screenings prior to admission. This likely leads to longer length of stay and greater overall retention.
From a workforce perspective, CCRCs often address staffing shortages by leveraging their ability to employ/assign workers across various levels of care, in order to fill staffing gaps. This staffing strategy can lead to improved resident experience and consistent quality of care, while also promoting a sense of community for both residents and staff.
Additionally, entrance fee CCRCs tend to offer financial structure and stability to residents, and residents of entrance fee CCRCs tend to have more financial resources, mainly due to the screening of financial conditions prior to admission. This can also lead to greater resident retention.
Further, operators of entrance fee CCRCs often have greater access to capital compared to rental CCRCs due to substantial upfront revenue generated from entrance fees, often financed through the sale of residents’ homes, and typically have access to different financing options.
Recovery of Regional Occupancy Rates by Payment Type – Entrance Fee CCRCs vs. Rental CCRCs
In the first quarter of 2023, entrance fee CCRCs maintained higher occupancy rates than rental CCRCs across all regions. The largest differences in occupancy between entrance fee and rental were reported for the West North Central region, where entrance fee CCRC occupancy was 7.2 percentage points higher than rental, followed by the Mountain (5.6 percentage points), and the Southeast (5.4 percentage points).
Strong Occupancy Rates in Mid-Atlantic, Northeast, and Pacific. The Mid-Atlantic, Northeast, and Pacific regions had the strongest occupancy rates for both entrance fee and rental CCRCs in the first quarter of 2023. The occupancy rates within these regions with respect to payment type were above the average occupancy rate for entrance fee CCRCs (89.3%) and rental CCRCs (84.4%) in the combined 99 NIC MAP Primary and Secondary Markets.
Mid-Atlantic and Southwest Regions Closest to Recovery. For entrance fee CCRCs, the Southwest and Mid-Atlantic regions are the closest to fully recovering and returning to the occupancy levels of the first quarter 2020. The Southwest region has reached 86.0% occupancy, while the Mid-Atlantic regions is at 91.1%. Both regions are within 1.4pps and 2.2pps, respectively, of reaching pre-pandemic first quarter 2020 levels. As for rental CCRCs, the Southwest region (84.3%) has fully recovered and returned to the occupancy level of the first quarter 2020.
1Q 2023 Market Fundamentals by Care Segment – Entrance Fee CCRCs vs. Rental CCRCs
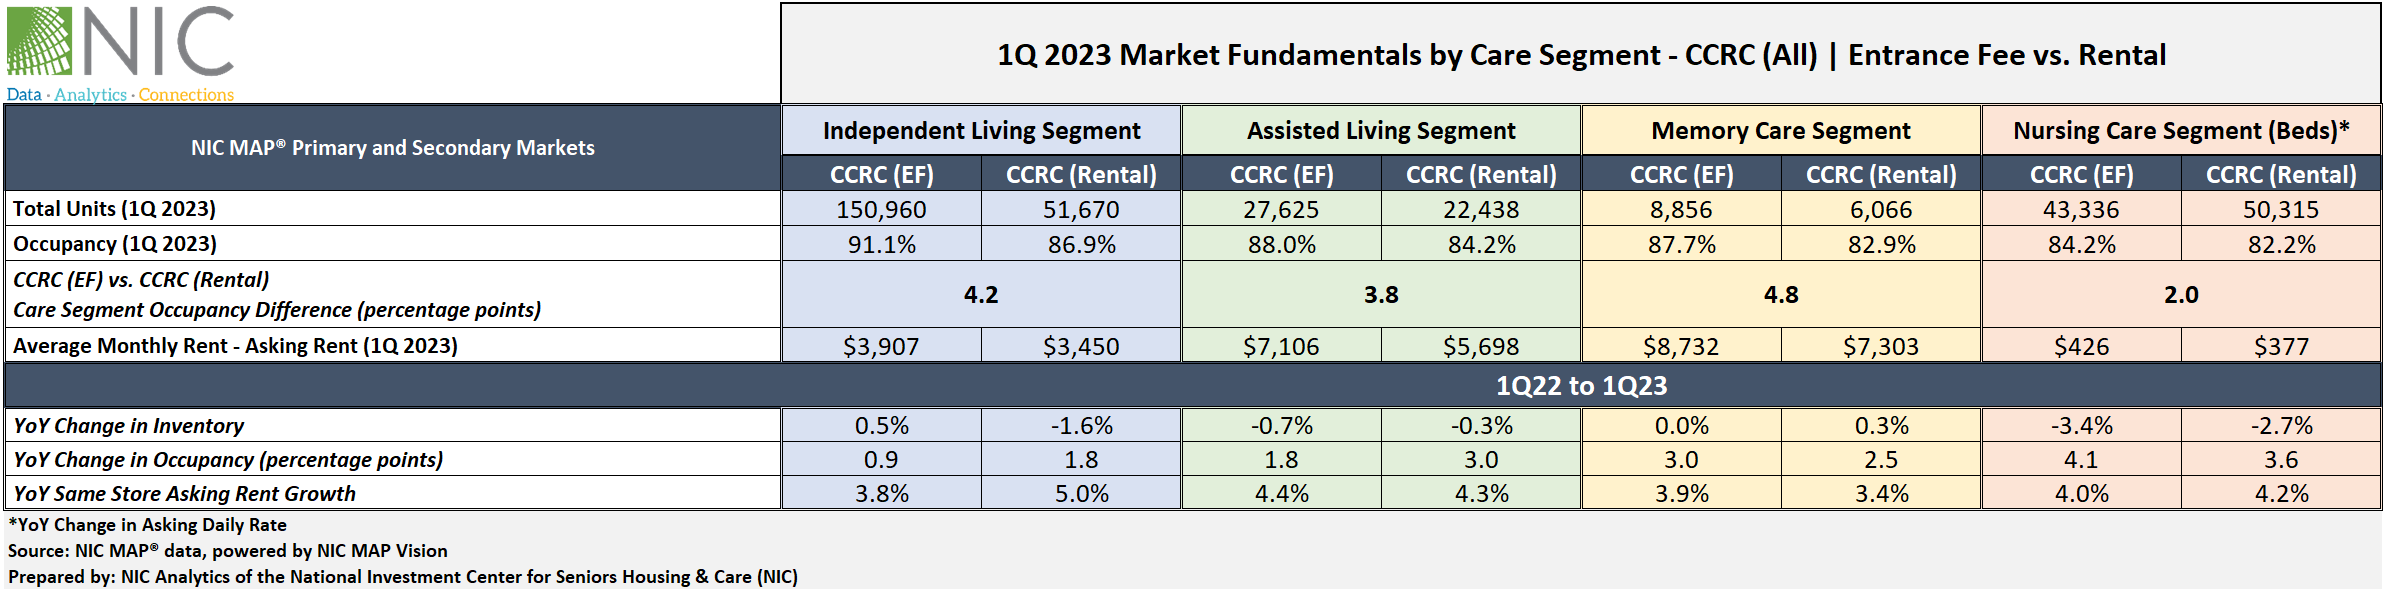
The exhibit below illustrates the relative market performance of entrance fee CCRCs compared with rental CCRCs by care segment in the first quarter of 2023 and includes year-over-year changes in occupancy, inventory, and asking rent growth.
Occupancy. Overall, the occupancy rate for entrance fee CCRCs continued to outpace that of rental CCRCs across all care segments. The difference in the first quarter 2023 occupancy rates between entrance fee CCRCs and rental CCRCs was largest for the memory care segment (4.8pps) and the independent living segment (4.2pps), and smallest for the nursing care segment (2.0pps).
The entrance fee CCRC independent living care segment had the highest occupancy (91.1%) in the first quarter of 2023, followed by entrance fee CCRC assisted living and memory care segments (88.0% and 87.7%, respectively).
In terms of occupancy improvements from one year ago, the largest occupancy gains for both entrance fee CCRCs and rental CCRCs were seen across nursing care segments (4.1pps and 3.6pps, respectively) -partly due to supply dynamics (negative inventory growth), while the smallest gains were seen across independent living segments (0.9pps and 1.8pps, respectively).
Asking Rent. The monthly average asking rent for entrance fee CCRCs across all care segments remained higher than rental CCRCs. The highest year-over-year asking rent growth for entrance fee CCRCs was noted in the assisted living segment (4.4% to $7,106). For rental CCRCs, the largest year-over-year asking rent growth was noted in the independent living segment (5.0% to $3,450). Overall, year-over-year asking rent growth across all care segments and payment types was around 4% in the first quarter 2023.
Note, these figures are for asking rates and do not consider any discounting that may be occurring.
Inventory. From year-earlier levels, nursing care inventory for both entrance fee and rental CCRCs experienced the largest declines (negative 3.4% and 2.7%, respectively). The highest year-over-year inventory growth was reported for the entrance fee CCRC independent living segments (0.5%) and rental CCRC memory care segments (0.3%).
Negative inventory growth can occur when units/beds are temporarily or permanently taken offline or converted to another care segment, outweighing added inventory.
1Q 2023 Occupancy Distribution by Care Segment – Entrance Fee CCRCs vs. Rental CCRCs
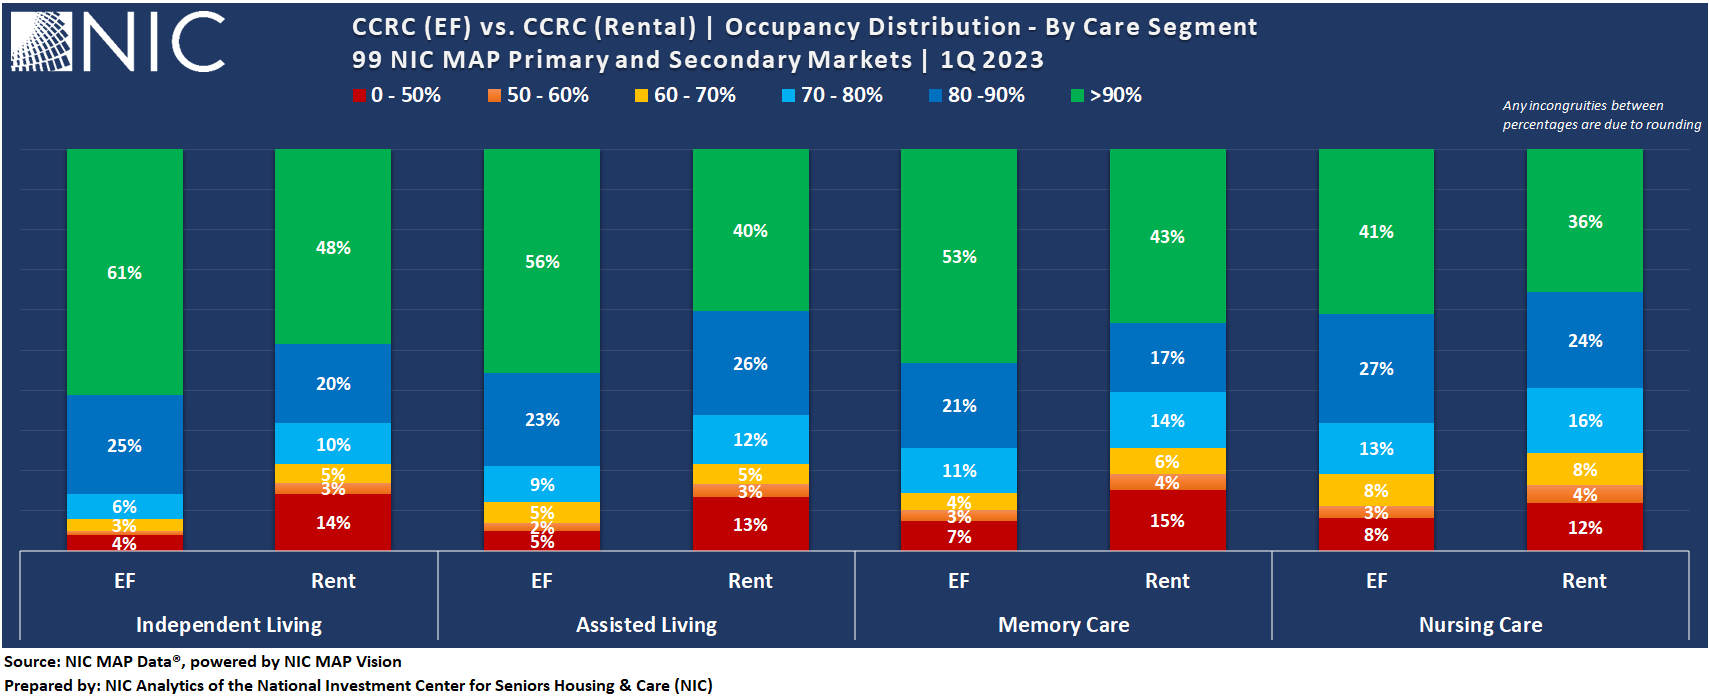
Moving beyond the analysis of average occupancy rates, the exhibit below explores the distribution of occupancy rates across entrance fee and rental CCRC care segments and provides deeper insight into the occupancy patterns.
Interestingly, there is a greater prevalence of entrance fee and rental CCRC care segments within the higher occupancy rate ranges. As the exhibit below shows, the most notable share is observed in the >90% occupancy range, ranging from 36% in rental CCRC nursing care segments to 61% in entrance fee CCRC independent living segments. The 80-90% occupancy range follows, with shares ranging from 17% in rental CCRC memory care segments to 27% in entrance fee CCRC nursing care segments.
Entrance Fee CCRCs. The combination of the 80-90% occupancy range and >90% occupancy range shows that 86% of entrance fee independent living segments reported an occupancy rate above 80% in the first quarter of 2023. This represents the largest share across all care segments and payment types. Assisted living follows closely at 79%, while memory care stands at 74%, and nursing care stands at 68%.
For rental CCRCs, 68% of independent living segments reported an occupancy rate above 80%, followed by assisted living segments at 66%, and memory care and nursing care segments both at 60%.
While these positive figures are encouraging, there are still segments within both entrance fee and rental CCRCs that report relatively low occupancy rates. The largest shares of low occupancy were noted in rental CCRC memory care segments (15% below 50% occupancy, 4% within the 50-60% occupancy range, and 6% within the 60-70% occupancy range) and rental CCRC nursing care segments (12% below 50% occupancy, 4% within the 50-60% occupancy range, and 8% within the 60-70% occupancy range). It is worth mentioning that there are fewer entrance fee care segments within these relatively low occupancy cohorts.
In conclusion, the unprecedented challenges posed by the pandemic have had a profound impact on the senior housing and care industry. To ensure financial stability and sustainability as the sector navigates through recovery, it may be strategic to aim for a higher occupancy rate, even above pre-pandemic levels (this analysis showcased the higher occupancy ranges’ dominance across all care segments). This takes into account the need to mitigate the lingering effects of the pandemic, adapt to changing market dynamics, and address the rising costs of operations. Properties with an occupancy rate above 80%, which are depicted as the majority in this analysis, are likely better positioned to maintain a healthy bottom line and navigate the evolving market conditions.
Look for future blog posts from NIC to delve deep into the performance of CCRCs.
Are you interested in learning more? To learn more about NIC MAP Vision data, and about accessing the data featured in this article, schedule a meeting with a product expert today.
This article originally appeared in Ziegler’s Senior Living Finance Z-News.