NCREIF publishes the most widely used private real estate investment benchmark in the U.S., the “NPI” (NCREIF Property Index), which tracks investment returns of more than 12,000 properties that are held by institutional investors. Seniors Housing is now included as a standalone sector in the NPI, a long awaited and highly important recognition for the sector that NIC has been striving toward.
For more than two decades, NIC has participated in NCREIF membership and has appreciated the opportunity to bring NIC’s senior housing expertise to the organization, highlighting the property type’s unique investment characteristics.
In the first quarter of 2024, NCREIF published its new Expanded NPI, which grew the index from real estate’s traditional “4 Food Groups” (Office, Retail, Industrial, Apartment) to include Seniors Housing. This sector is comprised of four subsectors: Independent Living, Assisted Living, Continuing Care, and Skilled Nursing.
This expanded index – which now breaks out Seniors Housing from an “Other” subsector outside of the Index into its own standalone sector included in the Index – is important because private equity institutional investors are evaluated based upon their portfolio holdings versus their designated benchmark. As a result, a zero allocation to any category within the benchmark, e.g., Seniors Housing, requires an explanation to clients. Overall, including Seniors Housing in the flagship NCREIF index raises its visibility with investors and makes it more difficult to exclude from investment portfolios, which in turn should help drive capital into senior housing and care.
When preparing to launch the Expanded NPI, NCREIF inquired whether senior housing should be included in the Residential sector. NIC highlighted the following distinctions for senior housing:
- Demand factors differ from traditional Residential and result in lower resident turnover, driving market fundamentals and investment returns that are uncorrelated (or at least less correlated) to traditional Residential.
- Higher level of operations than traditional Residential ranging from Lifestyle Coordinators at Active Adult communities; to dining, laundry, and transportation at independent living properties; to health care, ADL, and memory care services at assisted living and memory care communities.
- Due to larger operations and dual mandate of housing and care at higher acuity communities, senior housing operates under different regulations.
Learn more about senior housing investment returns in the most recent quarter and longer term below.
First Quarter 2024 Senior Housing Investment Returns
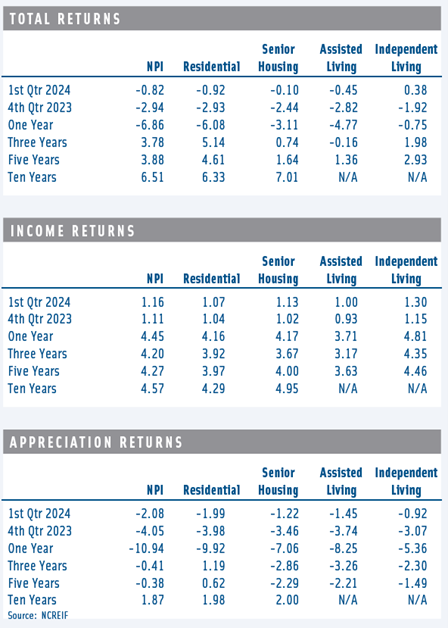
Senior housing posted a relatively flat total return of -0.10% in the first quarter of 2024, up from a total return of -2.44% in the prior quarter, outperforming the broader NPI, which posted a total return of -0.82% in the first quarter. Positive income returns for senior housing were offset by negative appreciation, driving relatively flat total returns for the quarter.
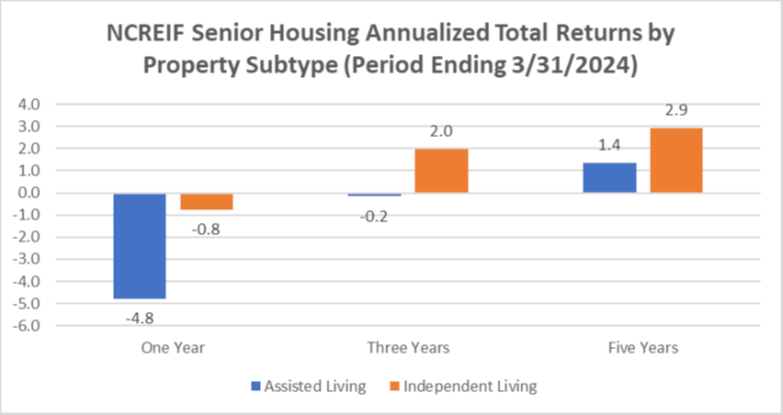
By senior housing property subtype, independent living outperformed on a total return basis (+0.38%) in the first quarter but was offset by assisted living (-0.45%). Over the longer term, independent living has outperformed assisted living on a total return basis over the one-, three-, and five-year periods. This outperformance may be driven by higher margins typically generated in lower acuity settings such as independent living, which require less staffing or FTEs.
The senior housing income return in the first quarter was 1.13%, in line with the residential sector (1.07%) and the overall NPI (1.16%). The senior housing appreciation (capital/valuation) return was -1.22% in the first quarter but better than the residential sector (-1.99%) and the overall NPI (-2.08%). The appreciation return is the change in value net of any capital expenditure incurred during the quarter. During the quarter, economic and capital market conditions drove flat or negative appreciation returns in all sectors.
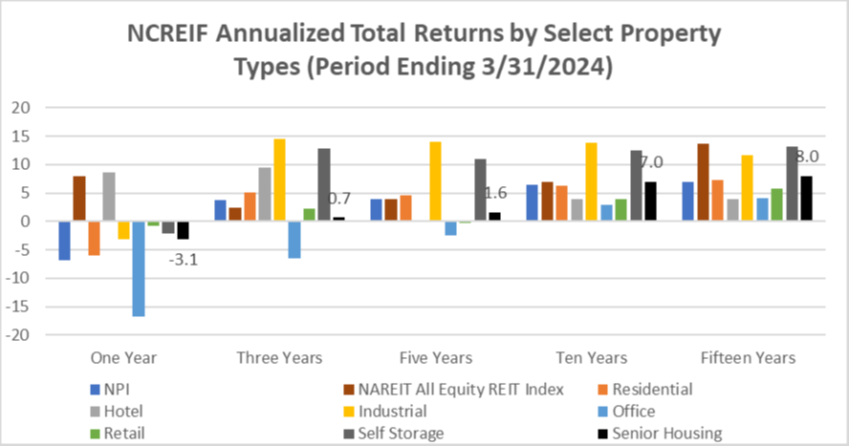
On a longer-term basis, the 7.01% annualized ten-year return for senior housing was the strongest of the main property types, except for industrial (13.79%) and self storage (12.58%), outperforming the NPI ten-year annualized total return of 6.51%. Income returns for senior housing (4.95%) surpassed the NPI (4.57%), as did the appreciation return (2.00% vs 1.87%).
The performance measurements cited above for senior housing reflect the returns of 217 senior housing properties valued at $11.20 billion in the first quarter. This was the highest property count in the NCREIF time series for senior housing, although market value was down from a high of $11.47 billion in mid-2023 due to negative appreciation returns. Overall, the number of senior housing properties tracked within the NPI has grown significantly from the 134 properties in the first quarter of 2020 that were valued at $6.3 billion. The additional properties may be influencing the overall performance returns of the index.
First quarter 2024 senior housing market fundamentals showed a continued recovery in occupancy rates in the 31 Primary Markets, according to NIC MAP® Data powered by NIC MAP Vision, as demand for senior housing units continued to outpace new supply. As a result, the occupancy rate for senior housing stood at 85.6%, up 0.5 percentage points from the prior quarter and only 1.5 percentage points below its pre-pandemic level of 87.1% in the first quarter of 2020. Overall, the relatively steady improvement in market fundamentals coupled with a record number of occupied units illustrates that today more older adults than ever before are residents in senior housing properties.
Source: NCREIF
Source: First Quarter 2024 NCREIF Performance Report, NIC Analytics