The following analysis examines initial rate growth and discounts offered compared to asking rates across all senior housing care segments. Additionally, the analysis explores initial rate growth patterns within select NIC MAP® metropolitan markets reported by NIC MAP Vision.
Key Takeaways:
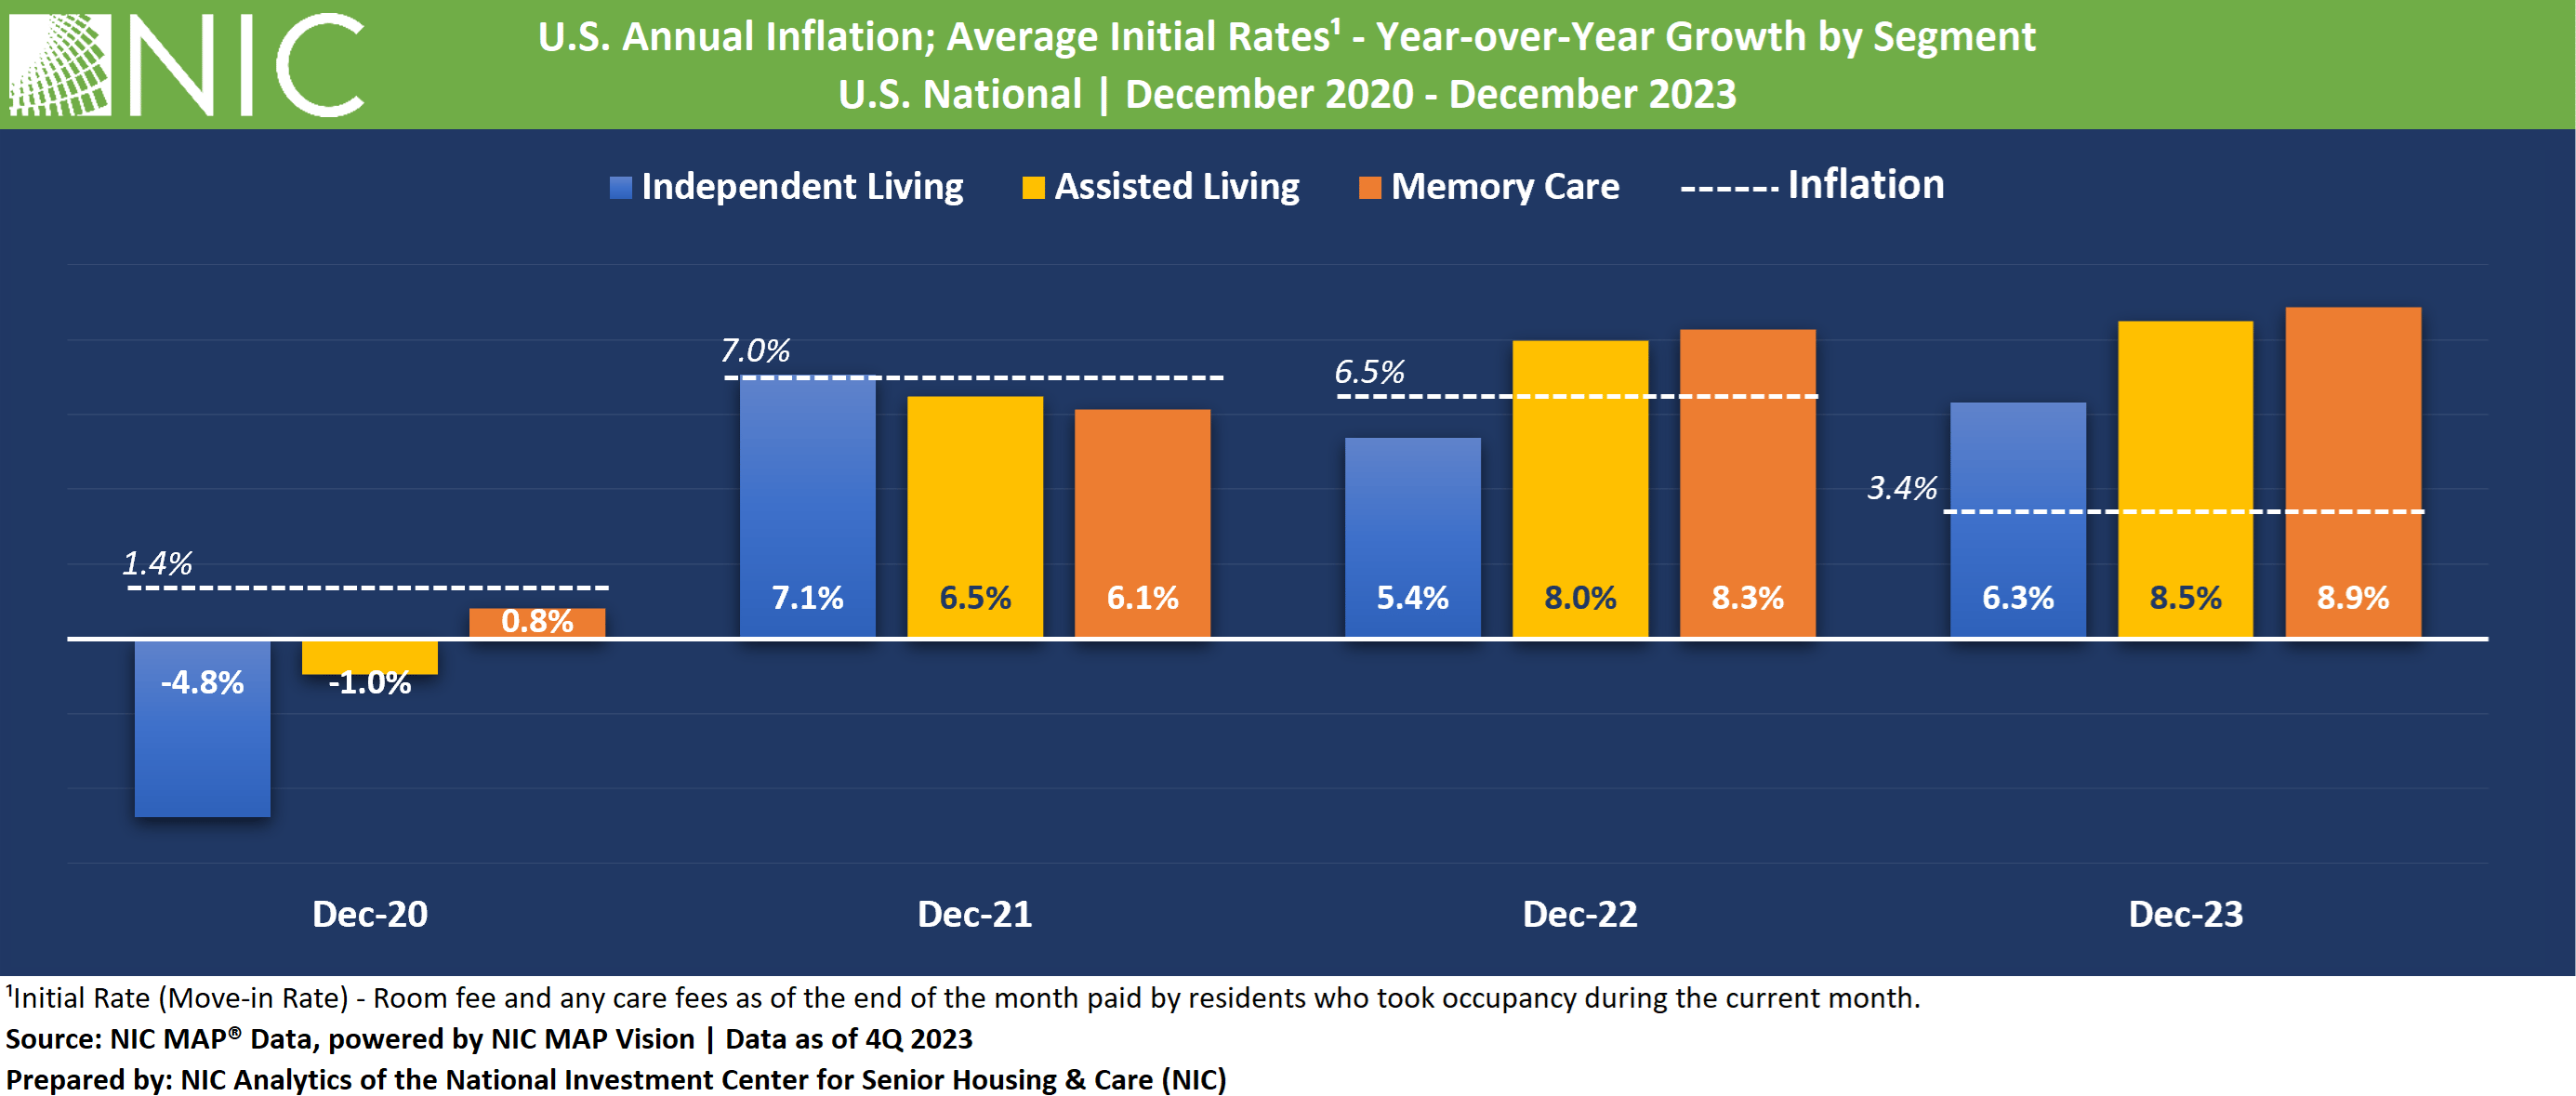
- Initial rate growth remained robust and near record highs for assisted living and memory care but showed a slight deceleration for independent living.
- Some markets saw negative year-over-year rate growth in initial rates in December 2023, contrasting with December 2022, when rates were positively growing, often in the double digits.
- Average initial rate growth is expected to align with inflation in 2024, based on historical trends.
- Discount strategies are being employed to offset higher initial rate growth and attract new residents.
- The pace of move-ins appears to be a factor influencing these pricing strategies.
- Independent living had the lowest average pace of move-ins in 2023, while memory care had the highest, followed by assisted living.
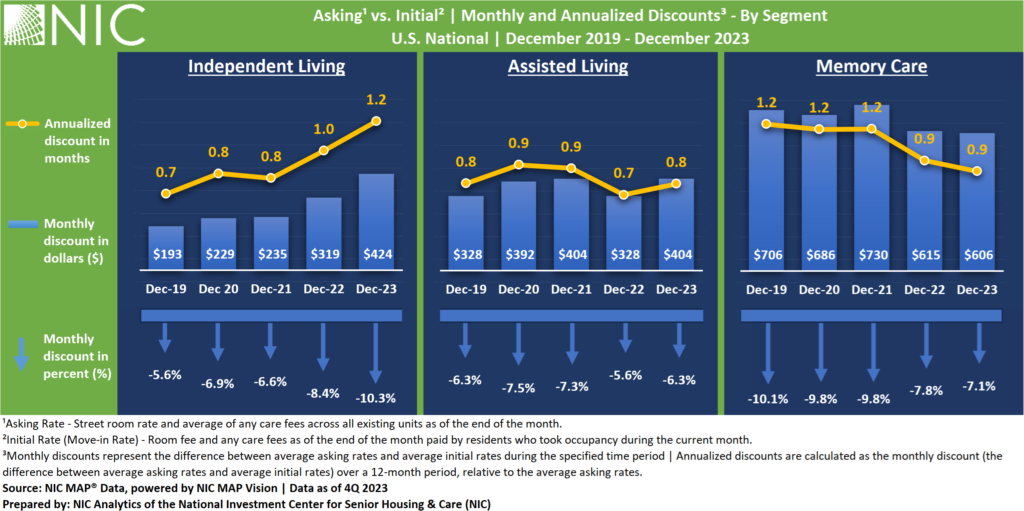
- Discounts increased in independent living, held steady in assisted living, and declined in memory care.
- In 2023, a NIC analysis revealed differences in rate increases and their effects on demand growth and occupancy recovery between independent living, often a lifestyle choice, and assisted living/memory care segments, which are primarily need driven. This trend is consistent across discount strategies.
The Pace of Growth in Initial Rates Remained Robust and Near Record Highs for Assisted Living and Memory Care but Showed a Slight Deceleration for Independent Living
For the independent living segment, average initial rate growth peaked during the annual period ending December 2021, with the largest annual growth (7.1%) among all senior housing care segments. However, this pace of growth decelerated in the following annual periods ending December 2022 (5.4%) and December 2023 (6.3%), with initial rate growth being the lowest compared with assisted living and memory care segments.
This deceleration may be partly attributed to relatively slow move-ins for independent living and increased competition from active adult properties. Notably, the pace of move-ins for independent living averaged around 2.3% of inventory in 2023, less than that of assisted living (3.3%) and memory care (3.6%).
The assisted living segment experienced relatively higher year-over-year increases in average initial rates compared to independent living in December 2022 and December 2023, with 8.0% and 8.5%, respectively.
The memory care segment showed the largest year-over-year increase for initial rates among the three care segments, with an 8.3% increase in December 2022 and an 8.9% increase in December 2023.
In December 2023, the average initial rate for an independent living unit was $3,702, translating to $44,424 annually. For an assisted living unit, the average initial rate was $6,017, equivalent to $72,204 annually. For a memory care unit, the average initial rate was $7,899, equivalent to $94,788 annually.
Separately, inflation rates, as measured by the Consumer Price Index (CPI), were 7.0% in December 2021, 6.5% in December 2022, and 3.4% in December 2023. Despite a noted easing of inflation, initial rate growth for all segments continued to outpace inflation as of December 2023, indicating that senior housing operators maintain the upper hand in pricing.
While these rate adjustments are being made to account for increased care and operating costs due to inflation, the pace of growth in rates is expected to align with inflation at some point in 2024. This projection is based on historical trends and the observed 6-to-9-month lag between rate growth and inflation that was observed in 2022.

Discounts and Initial Rate Growth Vary by Care Segment and Market
Interestingly, some markets experienced negative year-over-year growth in initial rates in December 2023. For example, in the assisted living segment, Cincinnati, OH and Dallas, TX, saw declines of 7.1% and 1.8%, respectively. Similarly, Detroit and Houston experienced decreases of 15.6% and 7.3%, respectively, in the memory care segment. This contrasts with December 2022, when year-over-year growth in initial rates across these markets and care segments was positive, often in the double digits.
Discounts Increased in Independent Living, Held Steady in Assisted Living, and Declined in Memory Care
In 2023, a NIC analysis revealed differences in rate increases and their effects on demand growth and occupancy recovery between independent living, typically a lifestyle choice, and assisted living/memory care segments, which are primarily need-driven. This trend is consistent across discount strategies.
In the independent living segment (frequently more of a lifestyle choice than need-driven), discounts between asking rates and initial rates have been increasing since December 2019. averaging 10.3% or $424 off the asking rate in December 2023, equivalent to 1.2 months on an annualized basis.
Initial rate discounts compared with asking rates in the assisted living segment were relatively lower and remained generally consistent with discounts offered since 2019, averaging 6.3% or $404 in December 2023, equivalent to 0.8 month on an annualized basis.
In the memory care segment, discounts between asking rates and initial rates averaged 7.1% in December 2023, equivalent to $606. Despite the relatively higher rate increases for the memory care segment, annualized discounts have been decreasing in the last two years, from 1.2 month in December 2021 to 0.9 month in December 2023.
These trends and patterns also suggest that the pace move-ins – lowest independent living and highest in memory care – had some impact on the discounts being offered.
In conclusion, the analysis raises some important questions: Are these pricing strategies sustainable? What is the long-term effect of these discount strategies on resident retention and the pace of move-ins and move-outs? Will senior housing properties maintain the upper hand in pricing as inflation continues to moderate?
Additional key takeaways are available to NIC MAP Vision subscribers in the full report.
NIC MAP Vision continues to work to onboard new data contributors and is dedicated to reporting more metropolitan markets. It is only with the support of Actual Rates data contributors and officially certified Actual Rates software partners that expanded metro-level reporting is now available. For more information on which metropolitan markets are now available to NIC MAP Vision subscribers, please contact a product expert at NIC MAP Vision today.
About the Report
The NIC MAP Vision Seniors Housing Actual Rates Report provides aggregate national data from approximately 300,000 units within more than 2,700 properties across the U.S. operated by 35 to 40 senior housing providers. The operators included in the current sample tend to be larger, professionally managed, and investment-grade operators as we currently require participating operators to manage 5 or more properties. Note that this monthly time series is comprised of end-of-month data for each respective month, and that the set of properties included in each month’s data set is subject to change. The sample is not “same store,” and occupancy is inclusive of newly opened properties in lease-up. NIC MAP Vision is working on including same-store rate metrics in a future release.
Interested in Participating?
The Actual Rates Data Initiative is an effort to expand senior housing data and we are looking for operators who have five or more properties to participate. NIC MAP Vision has expertise in extracting data from industry leading software systems, such as Aline, Alis, Eldermark, MatrixCare, Move-N, PointClickCare, Vitals, and Yardi and can facilitate the process for you.
Operators contributing data to the actual rates report receive a complimentary report which allows them to compare their own data against national and metropolitan market benchmarks. In addition to receiving a complimentary report, your organization benefits through:
- More informed benchmarking, strategic planning, and day-to-day business operations,
- Increased transparency, aligning with other commercial real estate assets in terms of data availability,
- Saved time, Actual Rates data is collected electronically directly from operators’ corporate offices, removing the need for telephone calls to individual properties, and
- Enhanced investment and efficiency across the sector.
Visit NIC MAP Vision’s website for more information.