The senior housing stabilized occupancy rate for the NIC MAP Primary Markets edged up to 84.7% in the May 2023 reporting period, up 0.1 percentage points (pps) from the April 2023 reporting period on a three-month rolling basis, according to intra-quarterly NIC MAP® data, released by NIC MAP Vision. From its pandemic record low of 80.3% in June 2021, senior housing stabilized occupancy increased by 4.4pps but remained 4.7pps below pre-pandemic March 2020 levels of 89.4%.
Stabilized occupancy – defined by NIC MAP Vision as the occupancy of properties that are (a) at least two years old, or (b) if less than two years old, properties that have achieved occupancy of at least 95.0% since their opening – still has more room to make up in order to reach pre-pandemic levels, when compared to the all-occupancy rate, which is currently 3.6pps below March 2020 levels.
The senior housing market is experiencing a pronounced change in occupancy dynamics. The May 2023 data shows that the gap between the stabilized occupancy rate, currently at 84.7%, and the all-occupancy rate, slightly lower at 83.6%, has reached its smallest point since 2014, standing at 1.1pps.
This narrowing gap indicates intense competition among senior housing properties, particularly those that have recently opened and are still in the lease-up phase. These newly opened properties are actively attracting residents and taking a share of the market from stabilized properties, despite higher asking rates in general.
Factors like the design and appearance of these new properties could be influencing residents’ choices. However, it’s important to consider that novelty and attractiveness alone do not guarantee success. Newly opened properties may not have had the opportunity to establish a solid reputation and may lack an experienced staff or team who have worked together effectively for a significant period of time.
The current trend also helps explain the overall recovery in occupied units, even though occupancy rates remain below pre-pandemic levels.
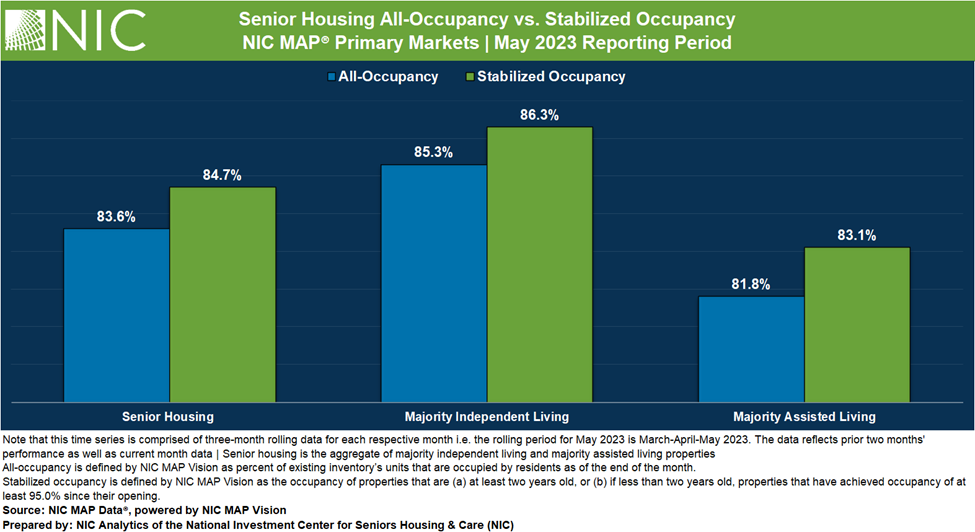
By Majority Property Type. At 86.3%, the stabilized occupancy rate for majority independent living (IL) properties for the NIC MAP Primary Markets has remained unchanged for four consecutive reporting periods beginning in February 2023. In the May 2023 reporting period, stabilized occupancy for independent living was 1.0pps above the all-occupancy rate (85.3%). For majority assisted living properties (AL), the stabilized occupancy rate for the NIC MAP Primary Markets was up 0.2pps to 83.1% from April 2023, and is now 1.3pps above the all-occupancy rate for assisted living (81.8%).
The inventory of majority independent living properties for the NIC MAP Primary Markets increased by 1.7% or 5,777 units from year-earlier levels in the May 2023 reporting period. Assisted living inventory increased by 1.3% over this same period. This was the smallest year-over-year inventory gain since NIC MAP Vision began reporting the data in 2005.
Stabilized Occupancy Across Select Metropolitan Markets. The stabilized occupancy rate for majority independent living properties increased or remained stable in 16 of the 31 Primary Markets in the May 2023 reporting period compared with April 2023. At 85.8%, Detroit independent living occupancy saw the largest increase from the prior month, up 0.7pps, but remained 4.2pps below March 2020 levels. Las Vegas independent living occupancy had the largest decline from April 2023, falling by 1.5pps in May 2023 to 85.3% and is now 5.7pps below pre-pandemic March 2020 levels.
For assisted living, the stabilized occupancy rate increased or remained stable in 25 of the 31 Primary Markets in May 2023. At 81.3%, Cincinnati assisted living stabilized occupancy saw the largest increase, up 0.9pps in May 2023 but still 4.4pps below March 2020 levels. The assisted living stabilized occupancy rate in San Jose had the largest decline and fell 1.5pps from the prior reporting period to 80.9% on a three-month rolling basis. San Jose stabilized occupancy remained 10.9pps below pre-pandemic levels, the largest gap across the 31 NIC MAP Primary Markets and property types.
Keep track of the most timely and comprehensive review of the sector’s market fundamentals and trends. The NIC Intra-Quarterly Snapshot monthly publication, available for complimentary download on our website, continues to provide a powerful and closely watched means to stay ahead of industry trends, even as senior housing markets sustain a fast pace of evolution and adaptation.