Strong Demand Has Provided a Stable Foundation for Senior Housing Occupancy Recovery.
According to second quarter 2023 NIC MAP® data, released by NIC MAP Vision, senior housing demand, as measured by the change in occupied units, continued to outpace new supply, marking its ninth consecutive quarter of growth with a net
absorption gain for the NIC MAP Primary Markets of 5,092 units or 0.9% from the prior quarter and 25,803 units or 4.6% from year-earlier levels. Senior housing occupied stock is now 2.6% or 15,026 units above the pre-pandemic 1Q 2020 level.
The strong demand for senior housing has been a significant driving force behind its ongoing occupancy recovery. With the population of older adults on the rise, there is a growing need for quality senior housing options. This consistent and growing demand has provided a stable foundation for many senior housing properties, helping to mitigate the impact on operators of economic fluctuations, rising expenses, and challenging capital market conditions.
Limited Construction Activity and Moderate Inventory Growth Have Assisted the Senior Housing Occupancy Recovery.
The continued recovery of senior housing occupancy has also been positively influenced by the moderate inventory growth that has resulted from fewer construction starts. In the second quarter of 2023, the inventory of senior housing properties in the NIC MAP Primary Markets increased by just 0.2% or 1,128 units from the prior quarter and 1.3% or 8,797 units from year-earlier levels. These were the smallest inventory increases in the last decade. Additionally, within the NIC MAP Primary Markets, construction starts continued to be limited compared with pre-pandemic levels. Notably, over the four-quarter period ending in the second quarter of 2023, senior housing starts totaled 11,673 units, marking a level not seen since 2012 and representing less than half of the starts reported during the four quarters of 2019.
A New Metric to Depict Strong Demand and Moderate New Supply: The Absorption-to-Inventory-Growth (AIG) Ratio.
To add perspective on demand and supply changes, NIC Analytics has created a new concept to consider. This measure offers a nuanced perspective on the balance between demand and supply. Called the absorption-to-inventory-growth ratio, this metric is calculated by dividing the number of newly occupied units within a given time period by the number of new units added to the market inventory during the same period. The ratio serves as an indicator of how effectively the market absorbs the newly supplied units. A higher positive ratio suggests stronger demand relative to the inventory growth, indicating a healthier balanced market, a lower positive ratio may indicate slower absorption of new units, potentially signaling an oversupplied market or weaker demand. Conversely, a negative ratio may indicate negative demand.
The exhibit below depicts the senior housing absorption-to-inventory growth ratio for the NIC MAP Primary Markets since 2006. In the second quarter of 2023, for every 10 new senior housing units added, there has been a net absorption of 45 units, the highest absorption-to-inventory-growth ratio (+45:10) since NIC MAP Vision began reporting the data in 2005. This indicates a strong demand for senior housing, as the market has been able to absorb a significantly higher number of units than were added during the second quarter of 2023.
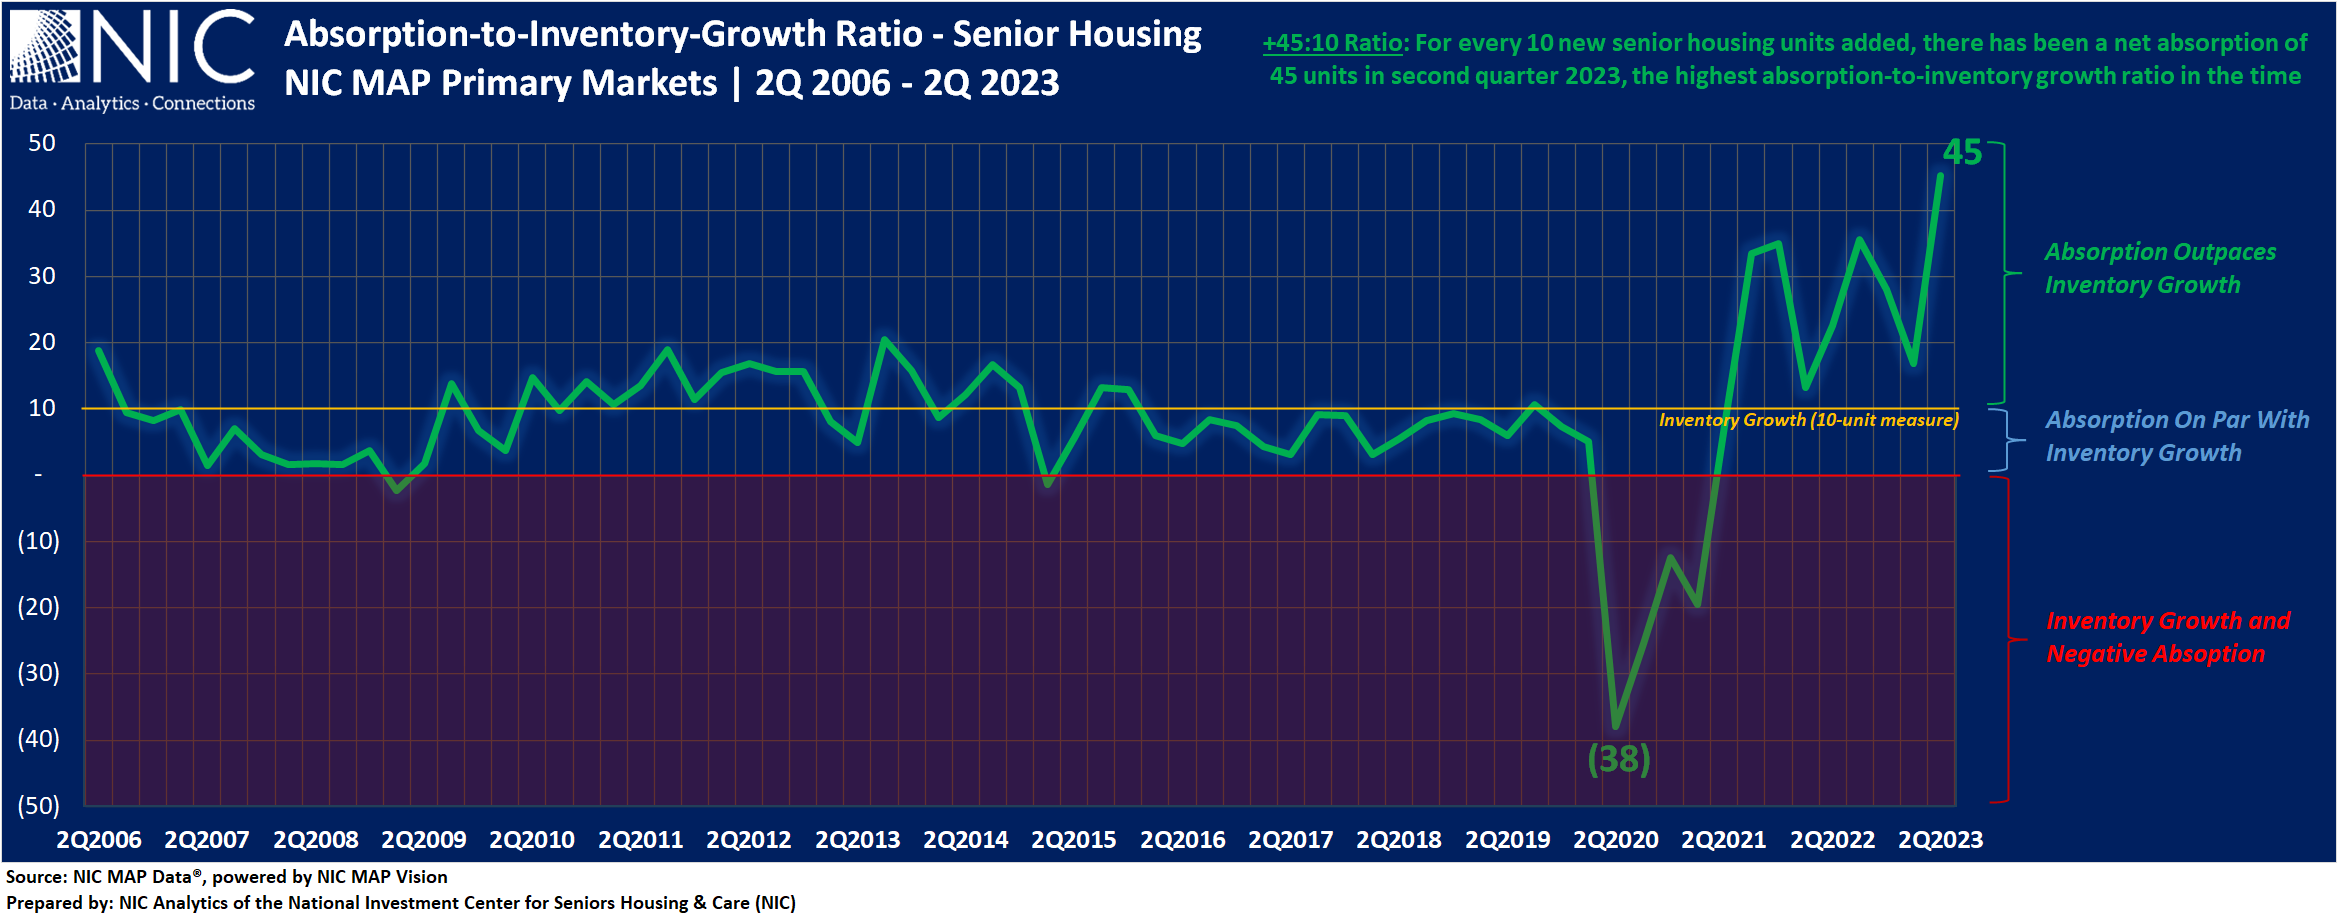
In the second quarter of 2020, the height of the pandemic, this ratio was -38:10; in other words, for every 10 new senior housing units added, 38 units had been placed back in the market.
From the second quarter of 2006 to the second quarter of 2023, the senior housing market experienced negative absorption in just six quarters. These quarters include the first quarter of 2009, the first quarter of 2015, and four consecutive quarters during the pandemic from the second quarter of 2020 to the first quarter of 2021.
Occupancy has Increased for Two Years Straight, but Still has Room Before Reaching Pre-Pandemic Levels.
As a result of this trend of positive demand coupled with a moderate pace of new supply and reflected in the recently strong absorption-to-inventory-growth ratios, the senior housing all-occupancy rate for the NIC MAP Primary Markets increased for the eighth consecutive quarter to 83.7% in the second quarter 2023, up 0.6 percentage points (pps) from the prior quarter. From its time series low of 77.8% in second quarter 2021, occupancy increased by 5.9pps but remained 3.4pps below pre-pandemic first quarter 2020 levels of 87.1%.
By majority property type. At 85.4%, the all-occupancy rate for majority independent living (IL) properties for the NIC MAP Primary Markets increased by 0.3pps from the first quarter 2023. For majority assisted living properties (AL), the all-occupancy rate for the NIC MAP Primary Markets was up 0.8pps to 82.0% in the second quarter 2023.
The senior housing market continues to experience a trend of higher acuity. Occupancy for assisted living continued to recover relatively faster than independent living. From its pandemic-related low, occupancy for assisted living increased by 8.1pps, more than twice the increase for independent living (up 3.8pps since second quarter 2021). However, occupancy for both independent living properties and assisted living properties remained 4.2pps and 2.5pps below their respective first quarter 2020 levels.
As background, assisted living occupancy for the NIC MAP Secondary Markets, currently at 83.6%, is only 0.6pps to fully recover and return to first quarter 2020 levels (84.2%).
Occupancy Recovery Across the 31 NIC MAP Primary Markets.
In 14 of the 31 NIC MAP Primary Markets, assisted living occupancy rates have either returned to pre-pandemic first quarter 2020 levels or exceeded them, with some markets being within less than 1pps from returning to their first quarter 2020 levels. Notable examples include Phoenix, where occupancy stands at 82.1%, surpassing the first quarter 2020 level by 1.6pps, and Kansas City, with occupancy at 85.9%, exceeding the first quarter 2020 level by 2.4pps. Other markets such as Orlando, Denver, Detroit, Tampa, Cleveland, Cincinnati, Dallas, Miami, Atlanta, San Antonio, and Portland have also demonstrated notable recovery in assisted living occupancy rates.
For independent living, out of the 31 NIC MAP Primary Markets, only five have returned/exceeded first quarter 2020 occupancy levels or are within less than 1pps of reaching that benchmark. Some of these markets include Riverside (85.3%, 1.7pps above first quarter 2020 level), and San Antonio (86.5%, 1.3pps above first quarter 2020 level).
In conclusion, the recovery of senior housing occupancy can be attributed to a combination of factors, including demand-side and supply-side measures as well as the combination of both measures as reflected in the absorption-to-inventory-growth ratio. The consistent and growing demand, coupled with moderate levels of new supply, has played a role in this recovery. However, it is important to acknowledge that occupancy rates for senior housing across different markets and properties still have room for further improvement before reaching recovery to pre-pandemic levels.
In future blogs, NIC Analytics will conduct an in-depth exploration of the absorption-to-inventory-growth (AIG) ratio to uncover insights into the dynamics of various markets, understand the efficiency of new unit absorption, and how supply and demand factors interact in shaping market conditions.
Keep track of the timely review of the sector’s market fundamentals and trends. The NIC Intra-Quarterly Snapshot monthly publication, available for complimentary download on our website, continues to provide a powerful and closely watched means to stay ahead of industry trends.
The July 2023 Intra-Quarterly Snapshot report will be released on our website on Thursday, August 10, 2023, at 4:30 p.m.
Interested in learning more about NIC MAP Intra-Quarterly data? To learn more about NIC MAP Vision data, schedule a meeting with a product expert today.